Product
Iron Ore Price Trend and Forecast
Iron Ore Price Trend and Forecast
Regional Price Overview
Get the latest insights on price movement and trend analysis of Iron Ore in different regions across the world (Asia, Europe, North America, Latin America, and the Middle East & Africa).
Iron Ore Price Trend for the Second Half of 2023
Iron ore prices were mostly found to be swinging upward during the last six months of 2023. Despite the sluggish nature of the global economy during this time, iron ore prices kept moving forward for the majority of the said time period.
Iron Ore Price Chart
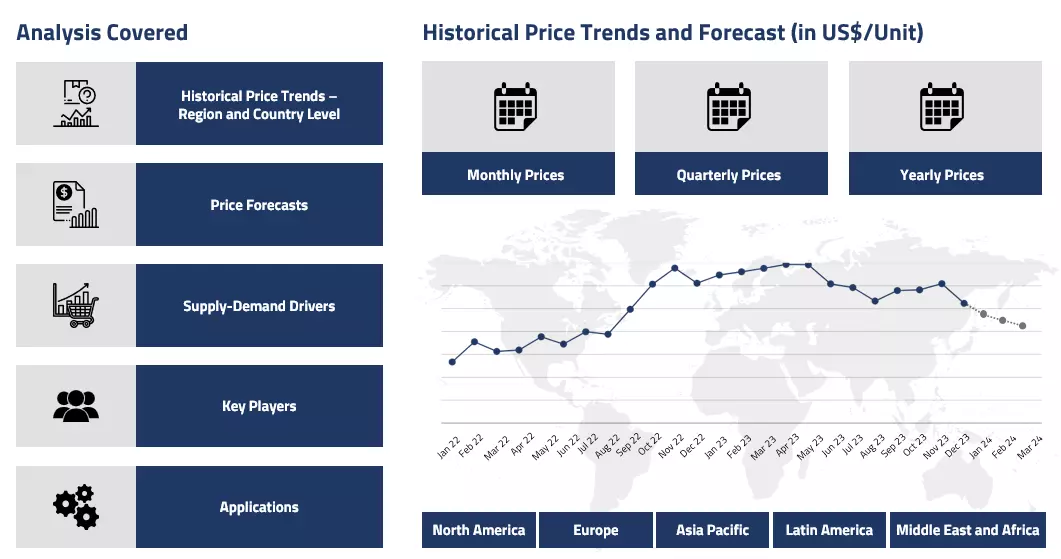
Please Login or Subscribe to Access the Iron Ore Price Chart Data
Consumption from sectors like shipping and machinery provided a positive push to the Chinese iron ore prices. In the Chinese domestic market, the monthly average prices went from about 123 USD/MT in July ’23 to around 143 USD/MT in December’23. With these prices, the Chinese iron market registered an overall gain of around 16%.
Since the regime in Beijing decided to provide credit assistance to the 50 biggest real estate developers in the country, the iron ore demands surged. Similarly, the global iron ore market also flourished during the given time period. In Europe, low raw material inventories kept supporting the futures, while a possible strike at BHP Australia generated concerns among suppliers and compelled them to buy more. Overall, positive market sentiments were witnessed throughout the said period.
Analyst Insight
According to Procurement Resource, iron ore market dynamics suggest a continuation of the positive trend in the prices in the coming months; the supply and demand outlooks look healthy.
Iron Ore Price Trend for the First Half of 2023
The iron ore market showcased mixed price trends during the discussed period. The first quarter witnessed the much-needed hike in the market, with average spot prices rising from around 126 USD/MT in January’23 to around 134 USD/MT in March’23 in the Chinese domestic market.
However, as the crude oil rates started normalizing, substantially decreasing the upstream costs for the iron ore industry, the prices declined for the majority of the second quarter. Because the fluctuations were in a narrow range, the market was fairly stable with a regular supply and demand dynamic. The second quarter closed with the spot prices averaging at around 120 USD/MT in June’23. Overall, a healthy market dynamic was observed.
Analyst Insight
According to Procurement Resource, given the stability in the Iron Ore industry, if other tensions don’t induce, not much change is anticipated going further; short-range fluctuations are expected.
For the Second, Third and Fourth Quarters of 2022
Iron Ore is the fundamental commodity for the existence of various heavy-duty and important industries. The steel, automobile, structure, manufacturing, and construction sectors depend on the iron ore industry. During the discussed time period of the year 2022, the iron ore industry struggled heavily. For the majority of the time period, the prices kept on tumbling lower and lower.
All industrial activities were shut down in China in the first quarter because of the strict lockdown and the war between Russia and Ukraine in the European backyard deprived that region of energy to run industries. With inflation rising through the roof, the demand kept on dampening, and very negative market sentiments were observed overall.
Analyst Insight
According to Procurement Resource, given the current global dynamics, a bullish price pattern is anticipated in the coming months as the demands are expected to rise.
For the First Quarter of 2022
Asia
In Q1 of 2022, iron ore prices were 34 RMB/MT from the Indian origin port. The iron ore market was already fueled by government initiatives that encourage the mineral's sector. Subsidies and foreign direct investments (FDI) in the mining industry were provided by governments. Government assistance comprises investments in mining projects by public financing institutions such as bilateral development banks and export credit agencies, fiscal support through budget allocations and tax exemptions, and investments by majority state-owned mining and utilities corporations.
For the Fourth Quarter of 2021
Asia
China's imports increased 14.6% month on month in November to their highest level since July 2020, despite a weak steel market dampening demand for the raw material. The world's largest consumer of iron ore imported 104.96 MMT, up from 91.61 MMT in October.
The surge in imports, led by items from Australia and Brazil, exceeded market forecasts in the face of falling iron ore prices and sluggish steel demand. China's benchmark iron ore futures saw their first yearly decrease in three years, following a roller-coaster year in which prices reached record highs before virtually halving in response to Beijing's tough output limitations to fulfil climate change targets.
Iron ore prices plummeted again to its lowest level in 18 months as demand from China for the steel producing material plummeted. It plummeted by 3.1% to 87.20 USD/MT, indicating that it was at its lowest price since May 2020. Australia’s exports are anticipated to decline even lower as China tries to pull back on its building investment and steel mills shift into care and maintenance mode.
Europe
The Kallanish KORE 62 % Fe index rose to 119.01 USD/dmt CFR Qingdao while 65% Fe index rose to 139.81 USD/dmt CFR. A shipment of 120,000 MTof PB Fines and 50,000 MT of PB Lump sold at a floating price.
North America
Iron ore prices are expected to fall 20% year on year to 130 USD/MT in 2022. According to the World Bank, the average yearly price of the mineral was 162 USD/MT, up 48% from 2020 levels. According to the World Steel Association and the US Geological Survey, worldwide iron ore output climbed by 5% year on year to 2.6 billion MT in 2021, owing to recovering steel demand following the pandemic.
The production in the United States increased by 21% year on year to 46 MMT, while production in Canada increased by 13% year on year to 68 MMT. In January 2022, the mineral was priced at roughly 133 USD/dmt, as opposed to 155.43 USD/dmt in December 2021.
Latin America
Heavy rainfall in southern Brazil's iron ore center of Minas Gerais state disrupted mining and train operations for Vale and other companies, assisting in the recovery of benchmark China import prices of the mineral. Vale, Usiminas, and other mine operators reported halts, notably at the Brucutu and Mariana complexes, as well as the suspension of a part of the Estrada de Ferro Vitoria a Minas railway, which was used to transport ore to Tubarao.
Brazil is the second largest supplier of the mineral to China, behind Australia. In the first nine months of 2021, Vale's Southern and Southeastern Systems produced around 40% of the company's iron ore. Vale is accustomed to operating in southern Brazil, where trains for iron ore shipments are frequently disrupted, and maintains three major port facilities in the region. Vale announced that following a review of its output with its bigger northern Brazil Carajas facility, the firm was keeping its 2022 projection of 320-335 MMT.
For First, Second and Third Quarters of 2021
Asia
The 62% Fe iron ore fines index reached an all-time high of 193.85 USD/dmt CFR North China, up 85 cents from the previous record of 193 USD/dmt set in February 2021, in a continuation of the price strength seen in Q1 2021, as increased steel production and margins in China boosted the mineral’s demand.
The week's mostly improved liquidity on port transactions reaffirmed the assumption that the recent increase in the mineral’s price was primarily due to restocking demand. Imports are expected to decline as China builds its own iron ore mines, which, when combined with domestic scrap production and pig iron, would eventually supply more than 45% of the country's total iron demand in 2025, up from 37% in 2020.
The increase in the price over the previous year was believed to have increased the profitability of mining China's iron ore deposits, which were normally low-grade. For June 30, the 62% Fe Iron Ore Index was trading at 218.40 USD/dmt CFR North China, up 4.30 USD/dmt on the day.
The Department of Industry increased its estimate by 14% from a March prediction, owing to robust iron ore prices, which reached an all-time high of more than 200 USD/MT in early May due to strong steelmaking demand. Advanced economies and the majority of Australia's major trading partners were continuing to make robust economic recoveries following the COVID-19 pandemic's economic effect.
Australia's mining sector accounts for around 10% of the country's gross domestic product, with the mineral being the primary export. Australia anticipated iron ore prices to average 137 USD/MT in the fiscal year, up from 128 USD/MT in March.
Europe
The European HRC spread averaged a new record high of 695 EUR/MT in the second quarter, up 61% from the previous quarter due to higher steel prices. Steel prices recovered in the previous year, resulting in a strengthening of margins, although spot prices fell from record highs. In July, Northwest European HRC prices averaged a new high of 1,172.64 EUR/MT ex-works, while the spot price was evaluated at 1,165 EUR/MT ex-works on July 30, slightly below the daily high of 1,190 EUR/MT ex-works on June 25.
On Aug. 2, the Northwest European HRC-steel raw materials spot spread decreased to Eur758/mt ($900/mt) in July from Eur761/mt in June. ArcelorMittal, Europe's largest steelmaker, stated that Q2 earnings did not fully reflect the improvement in steel to raw materials spreads owing to order price latencies, which will have a favorably impact on Q3. The business announced July 29 that the customary seasonal decline in demand and pricing is likely to be less significant than normal.
North America
Iron ore prices continued to grow to 214.14 USD/dmt in July 2021, before abruptly declining in August 2021.
Latin America
Brazil's shipments of the mineral fell in September, averaging 1,346 MMT per day in the month to the third week, down from 1,714 MMT in the first week. The fall in overseas sales of the raw material, which reached its highest level in 11 months in August, coincided with China's steel output curbs, which were placing downward pressure on raw material prices.
For the Year 2020
Asia
China is among the world's greatest iron ore producers, albeit its production is evaluated differently than in other countries. Based mostly on the production of raw ore rather than useable ore, China produced a projected 340 MMT in 2020. On the other side, while scrap import demand in India increased over the last year, prices for TSI Shredded Scrap CFR Nhava Sheva and 58% Fe iron ore fines indicated that scrap-to-iron-ore ratios remained near the all-time low of 1.82 in October 2020.
Since the fourth quarter, the ratio increased in lockstep with a rebound in scrap prices, averaging 2.05 scrap to iron ore in June. In June, TSI Shredded Scrap CFR Nhava Sheva averaged 517.50 USD/MT and increased to 530 USD/MT CFR on July 16. The scrap to iron ore ratio last peaked in February 2020, at 2.9.
Australia is the world's largest exporter of the mineral, accounting for the majority of the country's export earnings. Due to an unclear supply-demand scenario, the Australian government estimated that iron ore spot prices would nearly half to an average of 55 USD/MT by the end of the year. The Australian Treasury expected the mineral’s price to fall to 55 USD/MT FOB by the end of the year's final quarter because of an uncertain demand-supply outlook.
Iron ore fines 62% Fe ICX CFR Qingdao was assessed at 108.50 USD/dry metric tonne (dmt), up from 91.15 USD/dmt on 1 January. Iron ore prices stayed relatively stable as the impact of declining steel output outside China had been largely offset by strong demand from Chinese steel manufacturers and supply problems in Brazil.
Europe
Iron ore costs for steel production in Europe climbed steadily over the year 202, outpacing met coal costs further. Despite low steel demand, iron ore's relative cost to metallurgical coal in European steelmaking surpassed the previous record in July 2019. Contracts tied to China's import spot fines prices boosted iron ore prices in Europe to 118 USD/dmt CFR China, despite weaker contract pellet and lump premiums.
In July, the cost of a basket of iron ore products, including fines, lump, and pellets, required to create one tonne of pig iron reached 178 USD/dmt CFR Rotterdam basis, while met coke input costs were slightly more than 60 USD/MT CFR Rotterdam basis. This resulted in a differential of over 118 USD/MT in favor of the mineral and a cost of roughly 238.50 USD/MT for pig iron.
North America
Iron ore prices were above 100 USD/MT for most of the month of June, the first time since August 2019. Chinese demand was bolstered by a significant increase in steel output, which hit a new monthly high in May. Supply constraints also contributed to high pricing, with Brazilian shipments limited in response to an increase in coronavirus infections.
Latin America
Chinese and other purchasers had grown used to specific iron ore products and segments for operational efficiency, blending, and pollution control purposes. Brazil supplies low-alumina iron ores and grades that are mixed into products like Vale's BRBF fines and processed into concentrates at ports. According to figures from the country's economics ministry, the mineral’s shipments grew by one-third in December compared to the previous year. It transported 33.17 MMT of steelmaking raw material in November, compared to 24.99 MMT in December 2019.
Strong steel demand in China prompted mills to increase their iron ore use, pushing prices for the steelmaking raw material to their highest level in at least nine years. Daily index for iron ore 62% Fe fines, CFR Qingdao was 155.35 USD/MT in December 2020, up from 91.85 USD/MT the previous year. On January 4, the index was at 165.29 USD/MT. Brazilian iron ore prices averaged 90.50 USD/MT.
Procurement Resource provides latest prices of Iron Ore. Each price database is tied to a user-friendly graphing tool dating back to 2014, which provides a range of functionalities: configuration of price series over user defined time period; comparison of product movements across countries; customisation of price currencies and unit; extraction of price data as excel files to be used offline.

About
Iron Ores are rich with iron oxides, which make them suitable for the iron extraction. The physical appearance of these ores is not rigid because of their colour. It might vary from dark grey, bright yellow, deep purple to rusty red. The iron extracted from ores is generally found in the form of magnetite, hematite, goethite, limonite, or siderite.
Product Details
| Report Features | Details |
| Product Name | Iron Ore |
| Industrial Uses | Steel, Structural engineering applications, In maritime purposes, Automobiles, General industrial applications |
| Supplier Database | Samarco Mineracao S.A., Rio Tinto plc, Vale S.A., Anglo American plc, Fortescue Metals Group Ltd. |
| Region/Countries Covered | Asia Pacific: China, India, Indonesia, Pakistan, Bangladesh, Japan, Philippines, Vietnam, Iran, Thailand, South Korea, Iraq, Saudi Arabia, Malaysia, Nepal, Taiwan, Sri Lanka, UAE, Israel, Hongkong, Singapore, Oman, Kuwait, Qatar, Australia, and New Zealand Europe: Germany, France, United Kingdom, Italy, Spain, Russia, Turkey, Netherlands, Poland, Sweden, Belgium, Austria, Ireland Switzerland, Norway, Denmark, Romania, Finland, Czech Republic, Portugal and Greece North America: United States and Canada Latin America: Brazil, Mexico, Argentina, Columbia, Chile, Ecuador, and Peru Africa: South Africa, Nigeria, Egypt, Algeria, Morocco |
| Currency | US$ (Data can also be provided in local currency) |
| Supplier Database Availability | Yes |
| Customization Scope | The report can be customized as per the requirements of the customer |
| Post-Sale Analyst Support | 360-degree analyst support after report delivery |
Note: Our supplier search experts can assist your procurement teams in compiling and validating a list of suppliers indicating they have products, services, and capabilities that meet your company's needs.
Production Process
- Production of Iron Ores via Mining
Iron Ores are extracted through the process of mining. They are further processed in a magnetic separation for refining and finally obtain iron. However, Iron-Ore mining processes can vary depending on the type of ore being mined.
Methodology
The displayed pricing data is derived through weighted average purchase price, including contract and spot transactions at the specified locations unless otherwise stated. The information provided comes from the compilation and processing of commercial data officially reported for each nation (i.e. government agencies, external trade bodies, and industry publications).
Assistance from Experts
Procurement Resource is a one-stop solution for businesses aiming at the best industry insights and market evaluation in the arena of procurement. Our team of market leaders covers all the facets of procurement strategies with its holistic industry reports, extensive production cost and pre-feasibility insights, and price trends dynamics impacting the cost trajectories of the plethora of products encompassing various industries. With the best analysis of the market trends and comprehensive consulting in light of the best strategic footstep, Procurement Resource got all that it takes.
Client's Satisfaction
Procurement Resource has made a mark for itself in terms of its rigorous assistance to its clientele. Our experienced panel of experts leave no stone unturned in ensuring the expertise at every step of our clients' strategic procurement journey. Our prompt assistance, prudential analysis, and pragmatic tactics considering the best procurement move for industries are all that sets us apart. We at Procurement Resource value our clients, which our clients vouch for.
Assured Quality
Expertise, judiciousness, and expedience are the crucial aspects of our modus operandi at Procurement Resource. Quality is non-negotiable, and we don't compromise on that. Our best-in-class solutions, elaborative consulting substantiated by exhaustive evaluation, and fool-proof reports have led us to come this far, making us the ‘numero uno' in the domain of procurement. Be it exclusive qualitative research or assiduous quantitative research methodologies, our high quality of work is what our clients swear by.
Related News


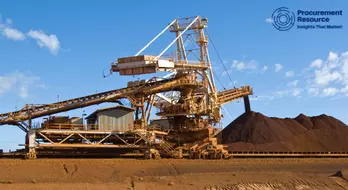
Table Of Contents
Our Clients
Get in Touch With Us

UNITED STATES
Phone:+1 307 363 1045

INDIA
Phone: +91 1203185500

UNITED KINGDOM
Phone: +44 7537 132103
Email: sales@procurementresource.com