Agar Agar Price Trend Analysis 2026: Latest News, Market Insights, Supply Demand Analysis, Price Drivers & Historical Prices

Procurement Resource Database

Laptop screen

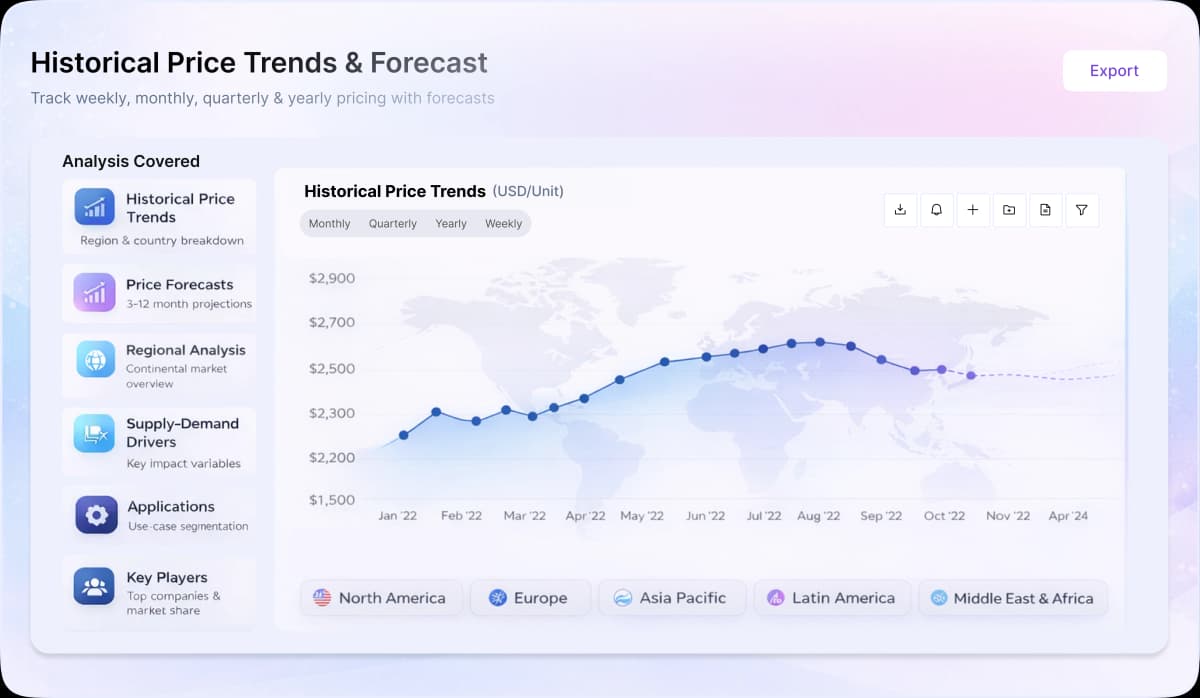
Turn price intelligence into action with the Procurement Resource Database. Log in or subscribe to unlock live price trends, historical charts, supplier databases, cost curves, and analyst-backed insights across chemicals, agriculture, energy, packaging, and more. Use these tools to benchmark your contracts, plan budgets with confidence, and stay ahead of market moves on every product you buy.

0

+

Products

0

+

Regions

0

+

Subscriptions

Asia

The Asian Agar-Agar market showed diverse pricing patterns across different regions in Q4’24. Chinese prices declined steadily throughout the quarter, primarily due to improved seaweed harvesting conditions and stable raw material availability. The harvest season that began in October provided sufficient Gracilaria supply, leading to increased production rates.

Japanese markets also witnessed a downward trend, influenced by abundant inventory levels and reduced freight costs, while the stronger yen made imports more affordable. In contrast, Indian prices moved upward, driven by robust domestic demand from the food industry, particularly during the festival and wedding season. Southeast Asian producers experienced stable production rates despite some weather-related challenges in coastal farming areas.

Europe

European Agar-Agar markets remained relatively stable during Q4, with slight variations across regions. The market benefited from increased Asian imports, particularly from China and Indonesia. Manufacturing activity in key markets like Germany and France maintained steady demand from the food processing sector. The pharmaceutical industry's consistent consumption patterns helped maintain price stability. Western European countries saw marginally higher prices compared to Eastern Europe due to higher energy costs affecting local processing facilities.

North America

North American markets experienced moderate price fluctuations during Q4. The region relied heavily on imports, with changing ocean freight rates influencing price movements. Demand from the food processing industry remained strong, particularly in the natural food additives segment. The market saw increased interest from pharmaceutical manufacturers, especially in the United States. Canadian markets aligned closely with US trends, though with slightly higher prices due to additional transportation costs.


About Agar Agar

Agar-agar is extracted from red algae and is widely employed in the food industry. It is gelatinous in nature with no odor or color. In the food industry it functions as a thickening agent in the production of desserts, jellies, and confectionery items. In addition to this, it is also used in microbiology as a substrate for bacterial and fungal cultures as it remains as a stable gel at a wide range of temperatures.

Agar Agar Product Detail

HS Code
13023100
Chemical Formula

C14H24O9

CAS Number
9002-18-0
Molecular Weight
336.33 g/mol
Industrial Uses

Pharmaceuticals, Dentistry, Cosmetics, Textile, Food Industry

Supplier Database

Neogen Food Safety, HISPANAGAR, AGARMEX, S.A., INDUSTRIAS ROKO S.A.

Regional Coverage

Asia Pacific

China, India, Indonesia, Pakistan, Bangladesh, Japan, Philippines, Vietnam, Iran, Thailand, South Korea, Iraq, Saudi Arabia, Malaysia, Nepal, Taiwan, Sri Lanka, UAE, Israel, Hongkong, Singapore, Oman, Kuwait, Qatar, Australia, and New Zealand

Europe

Germany, France, United Kingdom, Italy,Spain, Russia, Turkey, Netherlands, Poland, Sweden, Belgium, Austria, Ireland Switzerland, Norway, Denmark, Romania, Finland, Czech Republic, Portugal and Greece

North America

United States and Canada

Latin America

Brazil, Mexico, Argentina, Columbia, Chile, Ecuador, and Peru

Africa

South Africa, Nigeria, Egypt, Algeria, Morocco

CurrencyUS$ (Data can also be provided in local currency)

Supplier Database AvailabilityYes

Customization ScopeThe report can be customized as per the requirements of the customer

Post-Sale Analyst Support360-degree analyst support after report delivery

Note: Our supplier search experts can assist your procurement teams in compiling and validating a list of suppliers indicating they have products, services, and capabilities that meet your company's needs.

Agar Agar Production Processes

In the initial phase of production of agar-agar, the extract from seaweed is treated, filtered, gelled, de-watered, dried and grinded. The extract is then standardized to give the final product in the form of powder or flakes.

Frequently Asked Questions

The agar agar outlook for 2025 points to firm prices with potential upward movement if seasonal demand or export activity picks up. Asia saw continuous price increases driven by strong food and pharmaceutical demand in China and India, seasonal events like Golden Week, and rising export demand from Japan that tightened supply. Europe faced higher prices due to sourcing and freight costs, with no local production to buffer import reliance. North America recorded gradual increases as consistent food, pharmaceutical, and specialty product demand combined with seasonal procurement spikes.
Agar agar prices are driven mainly by seaweed feedstock availability and by the concentration of supply in Asia, since China, India and Japan dominate production, so any tightness in Gelidium or Gracilaria seaweed or in extraction capacity moves the market. Sourcing, freight and energy costs shape landed prices into import-dependent regions such as Europe and North America, which have little local production. Demand from food, pharmaceutical and biotechnology (culture-media) users provides the pull. Tight seaweed supply or higher freight against steady demand lifts prices, while ample supply eases them.
Agar agar production is concentrated in Asia, with China and India as primary exporters driving global supply and Japan a notable producer and buyer. Europe and North America rely heavily on Asian imports with minimal local production, creating supply-concentration risk. Producers include Hispanagar, Agarmex, Industrias Roko and PT Agarindo Bogatama. Asia-Pacific leads on abundant seaweed resources, established extraction infrastructure and lower costs, while Western demand is driven by preference for plant-based, natural ingredients.

Agar agar is produced via the gel-press method using red algae seaweed, specifically Gelidium or Gracilaria species, as the sole raw material. The process begins with extracting agar from the seaweed, followed by filtration to remove residues and impurities. The filtered solution is then gelled, dewatered through gel-press, dried, and ground. Final standardization yields agar agar as a powder or flake, used downstream as a gelling and thickening agent in food and beverage, pharmaceuticals, microbiology culture media, brewing, and cosmetics.


Agar agar demand is led by the food industry, where it is a gelling and thickening agent in desserts, jellies, confectionery and brewing clarification, alongside pharmaceutical use as a stabiliser and tablet binder and as a microbiology culture medium; cosmetics and plant-based applications add further demand. Because these are broad, largely non-cyclical uses, agar agar carries a steady demand base, so prices move mainly with seaweed feedstock availability, Asian supply concentration and freight costs against this downstream pull.
China and India dominate agar agar supply, with Asia as the primary production base and the sole source for European and North American importers. This concentration extends lead times, inflates freight and sourcing costs, and leaves buyers with limited negotiating power. Europe has no meaningful local production, so any disruption or policy shift in China or India would immediately tighten global availability and push prices higher across all importing markets.
Procurement Resource assesses agar agar prices through a structured methodology combining primary engagement with producers, suppliers and traders, secondary market data, monitoring of feedstock and input costs, trade-flow and inventory tracking, and exchange or spot benchmarks. This data-driven approach is validated and translated into a transparent price assessment and outlook. The detailed methodology is available on the Procurement Resource website.

Our Price Analysis Methodology

About the Author

Vishakha Agrawal profile photo

Vishakha Agrawal

Lead - Social & Development Research

Delivering procurement intelligence and supply chain analytics across healthcare, FMCG, and chemicals sectors, with expertise in cost modeling, vendor mapping, and spend optimization to support data-driven sourcing decisions and procurement outcomes.

Schedule Demo

Schedule A Demo

Experience how Procurement Resource transforms raw material price data into clear, decision ready intelligence. Optimise your performance with reliable, expert market data and analysis. Schedule your demo today to experience a live walk-through where our experts will showcase interactive price charts, forecasted prices, and insights driving the prices for your key commodities, tailored to your workflows. Contact us now!

Our Team will be happy to assist you

We are just a text away

+1

Still Need Help?

Europe & Africa

+44 7573 171117

Sales@procurementresource.com

USA & Canada

+1 307 363 1045

Sales@procurementresource.com

APAC

+91 8850629517

Sales@procurementresource.com

Unlock full access to Procurement Resource's price databases, interactive charts, and short-term forecasts for thousands of commodities. Elevate your sourcing decisions by comparing prices across regions, downloading historical data, and layering in analyst-backed insights, all with our flexible plans that scale as your portfolio grows.

Still have any Questions

Contact Us
Mastercard
Wire
VISA
Stripe

Why Procurement Database

Commodity Market Intelligence

Commodity Market Intelligence

Track prices, market movements, supply-demand dynamics, and industry developments across hundreds of commodities through a centralized intelligence platform built for informed procurement decisions.

Price Forecasts & Market Outlooks

Price Forecasts & Market Outlooks

Understand market fluctuations using analyst-backed forecasts, historical pricing patterns, and evolving industry trends to strengthen sourcing strategies and budget planning.

Cost & Procurement Optimization

Cost & Procurement Optimization

Leverage cost models, pricing benchmarks, and procurement insights to evaluate purchasing opportunities, improve negotiations, and enhance operational efficiency.

Global & Regional Market Insights

Global & Regional Market Insights

Access region-specific price trends, trade activities, capacity changes, and supply chain developments influencing commodity markets worldwide.

1/4