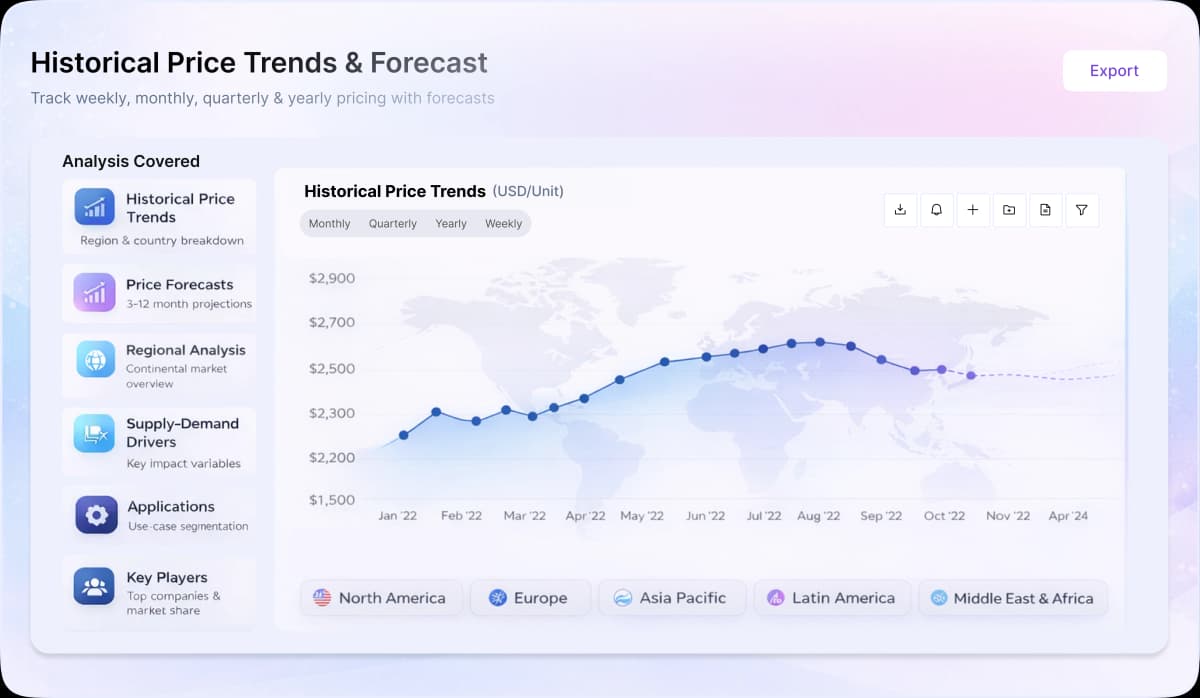
Carbon Dioxide Price Trend Analysis 2026: Historical Prices, Latest News, Supply Demand Analysis, Price Drivers & Market Insights

Udeesha Tomar profile photo
Written ByUdeesha Tomar

Procurement Resource Database

Laptop screen

Turn price intelligence into action with the Procurement Resource Database. Log in or subscribe to unlock live price trends, historical charts, supplier databases, cost curves, and analyst-backed insights across chemicals, agriculture, energy, packaging, and more. Use these tools to benchmark your contracts, plan budgets with confidence, and stay ahead of market moves on every product you buy.

0

+

Products

0

+

Regions

0

+

Subscriptions

Asia

The market for Carbon Dioxide in Asia displayed variable trends throughout the period. During the second quarter, prices initially maintained stability supported by steady demand from beverage carbonation and food processing sectors. However, the trajectory shifted downward as seasonal factors reduced industrial activity. The availability of calcium carbonate, a key feedstock in acid-based production methods, improved due to higher output rates, which helped contain production costs but coincided with weakening terminal demand. The third quarter brought mixed price movements as construction and industrial sectors experienced reduced activity, limiting demand for industrial-grade carbon dioxide. High feedstock inventories and destocking activities added to market pressures. Toward the quarter's end, some recovery emerged as maintenance shutdowns, adverse weather conditions, and logistical constraints tightened supply while demand gradually returned. The fourth quarter saw renewed downward pressure as feedstock availability remained ample while demand from plastics and industrial applications softened, with accumulated inventories keeping prices under pressure through year-end.

Europe

European Carbon Dioxide markets experienced sustained weakness during the second quarter, with subdued demand from coatings, construction, and food and beverage applications. Enhanced production capacities and adequate feedstock supplies from limestone-based operations created oversupply conditions that persisted into the third quarter. Holiday-season slowdowns and muted activity across construction and industrial segments kept demand on the lower end. The fourth quarter brought some upward movement as feedstock costs increased due to higher energy prices and stricter environmental regulations affecting limestone quarrying operations. Logistics challenges including port congestion constrained supply chains, while regulatory changes in construction materials created additional market dynamics, though overall demand remained moderate.

North America

North American markets exhibited oscillating patterns during the second quarter. Initial price weakness stemmed from subdued demand and moderate production levels, but mid-quarter recovery occurred as terminal demand improved and export orders increased. The third quarter brought consistent declines driven by muted industrial demand, surplus production capacity, and stable feedstock costs. Late quarter seasonal demand from food and pharmaceutical sectors triggered price increases as manufacturers replenished stocks. The fourth quarter stabilized as paper, plastics, and industrial gas sectors maintained steady consumption, while weather-related disruptions temporarily affected feedstock availability.


About Carbon Dioxide

Carbon dioxide (CO2) is a colorless, odorless gas with a slightly acidic taste, soluble in water, and denser than air. It plays a critical role in various industries due to its unique properties. In the food and beverage industry, CO2 is used for carbonation in drinks and preservation. It is essential for creating dry ice for refrigeration. In agriculture, CO2 enhances plant growth in greenhouses. Medical uses include insufflation gas in surgeries and respiratory therapies. Additionally, CO2 is used in fire extinguishers, chemical synthesis, extraction processes, and enhanced oil recovery in the petroleum industry.

Carbon Dioxide Product Detail

HS Code
281121
Chemical Formula

CO2

CAS Number
124-38-9
Molecular Weight
44.01 g/mol
Industrial Uses

Food and beverages, Refrigeration, Medical, Fire extinguishers

Supplier Database

Linde Plc, Air Products and Chemicals Inc, Air Liquide, Sicgil India Limited, Universal Industrial Gases

Regional Coverage

Asia Pacific

China, India, Indonesia, Pakistan, Bangladesh, Japan, Philippines, Vietnam, Iran, Thailand, South Korea, Iraq, Saudi Arabia, Malaysia, Nepal, Taiwan, Sri Lanka, UAE, Israel, Hongkong, Singapore, Oman, Kuwait, Qatar, Australia, and New Zealand

Europe

Germany, France, United Kingdom, Italy,Spain, Russia, Turkey, Netherlands, Poland, Sweden, Belgium, Austria, Ireland Switzerland, Norway, Denmark, Romania, Finland, Czech Republic, Portugal and Greece

North America

United States and Canada

Latin America

Brazil, Mexico, Argentina, Columbia, Chile, Ecuador, and Peru

Africa

South Africa, Nigeria, Egypt, Algeria, Morocco

CurrencyUS$ (Data can also be provided in local currency)

Supplier Database AvailabilityYes

Customization ScopeThe report can be customized as per the requirements of the customer

Post-Sale Analyst Support360-degree analyst support after report delivery

Note: Our supplier search experts can assist your procurement teams in compiling and validating a list of suppliers indicating they have products, services, and capabilities that meet your company's needs.

Carbon Dioxide Production Process

The general synthesis of carbon dioxide involves the reaction of carbonates and acids. In this synthesis also, calcium carbonate is reacted with strong acid, hydrochloric acid, to give carbon dioxide along with some side products.

Frequently Asked Questions

The 2026 carbon dioxide outlook points to stable prices with moderate regional variation. Asia may see firm pricing on steady plastics and textiles demand, though regulatory actions and logistics constraints could create intermittent tightness. Europe's balanced domestic supply and chemical plant capacity reductions, alongside environmental regulations on mining and emissions, may keep input costs elevated. North America's sufficient domestic supply and cautious buyer behaviour amid uncertain trade policies and tariffs should keep prices range-bound.
Carbon dioxide prices respond to supply-side pressures and demand shifts across Asia, Europe, and North America. In Asia, logistics bottlenecks can create supply tightness that pushes prices up, while weakening demand from plastics and construction can ease them, with rising energy costs and export complications adding volatility. In Europe, chemical plant capacity cuts raise input costs and squeeze calcium carbonate feedstock production economics, while environmental regulations on mining and emissions strain supply chains.
Linde plc, Air Liquide, Air Products and Chemicals, Taiyo Nippon Sanso, and Messer Group dominate the carbon dioxide market, producing CO2 from ammonia, hydrogen, and fermentation. Asia Pacific, led by China and India, is the largest consumption zone, driven by beverage carbonation, food processing, and industrial demand. Europe and North America follow with demand from packaging, food-grade, and construction. Latin America and Africa are smaller markets. The concentrated supply chain means capacity reductions at major European plants can quickly tighten regional availability and push input costs higher.
Two key developments are shaping the carbon dioxide market. In the US, supply tightness from liquefaction plants running near capacity has prompted food and beverage end users to expand on-site CO2 storage, supporting firm pricing. In Europe, expert skepticism over the European Commission's cost projections for integrating CO2 removals into the EU Emissions Trading System could constrain supply, keeping CO2 allowance prices firm or pushing them higher. Asia saw prices fluctuate through 2025 under calcium carbonate feedstock costs and logistics constraints, with beverage carbonation and food processing demand providing early support.
Carbon dioxide is produced primarily through the chemical reaction of calcium carbonate with hydrochloric acid, yielding CO2 along with by-products. The finished gas is then distributed across key downstream sectors: food and beverage for carbonation and dry ice, chemical manufacturing as a feedstock for urea and methanol, enhanced oil recovery in petroleum, medical applications for surgical insufflation, agriculture for greenhouse enrichment, and metal fabrication. Procurement is shaped by feedstock cost and availability, logistics, and trading infrastructure.
Food and beverage carbonation and fermentation are the primary demand drivers, with beverage makers and brewers requiring consistent supply for production runs. Chemical synthesis, metal fabrication, plastics manufacturing, and construction also contribute steady consumption. When these sectors ramp up activity, supply tightness from logistics constraints or calcium carbonate feedstock availability translates into upward price pressure, while weakening downstream demand in plastics or construction allows prices to ease.
Procurement Resource assesses carbon dioxide prices through a structured, data-driven methodology combining direct engagement with producers, suppliers and traders, secondary market data, monitoring of feedstock and input costs, trade-flow and inventory tracking, and exchange or spot benchmarks. These inputs are validated and translated into a transparent price assessment and outlook. The detailed methodology is available on the Procurement Resource website.

Our Price Analysis Methodology

About the Author

Udeesha Tomar profile photo

Udeesha Tomar

AVP - Strategy and Solutions

Leading procurement research solutions across chemicals, materials, and food & beverages, with expertise in price forecasting and market analytics.

Schedule Demo

Schedule A Demo

Experience how Procurement Resource transforms raw material price data into clear, decision ready intelligence. Optimise your performance with reliable, expert market data and analysis. Schedule your demo today to experience a live walk-through where our experts will showcase interactive price charts, forecasted prices, and insights driving the prices for your key commodities, tailored to your workflows. Contact us now!

Our Team will be happy to assist you

We are just a text away

+1

Still Need Help?

Europe & Africa

+44 7573 171117

[email protected]

USA & Canada

+1 307 363 1045

[email protected]

APAC

+91 8850629517

[email protected]

Unlock full access to Procurement Resource's price databases, interactive charts, and short-term forecasts for thousands of commodities. Elevate your sourcing decisions by comparing prices across regions, downloading historical data, and layering in analyst-backed insights, all with our flexible plans that scale as your portfolio grows.

Still have any Questions

Contact Us
Mastercard
Wire
VISA
Stripe

Why Procurement Database

Commodity Market Intelligence

Commodity Market Intelligence

Track prices, market movements, supply-demand dynamics, and industry developments across hundreds of commodities through a centralized intelligence platform built for informed procurement decisions.

Price Forecasts & Market Outlooks

Price Forecasts & Market Outlooks

Understand market fluctuations using analyst-backed forecasts, historical pricing patterns, and evolving industry trends to strengthen sourcing strategies and budget planning.

Cost & Procurement Optimization

Cost & Procurement Optimization

Leverage cost models, pricing benchmarks, and procurement insights to evaluate purchasing opportunities, improve negotiations, and enhance operational efficiency.

Global & Regional Market Insights

Global & Regional Market Insights

Access region-specific price trends, trade activities, capacity changes, and supply chain developments influencing commodity markets worldwide.

1/4