Drawn Bar Price Trend Analysis 2026: Historical Prices, Market Insights, Latest News, Supply Demand Analysis & Price Drivers

Pragati Agarwal profile photo
Written ByPragati Agarwal

Procurement Resource Database

Laptop screen

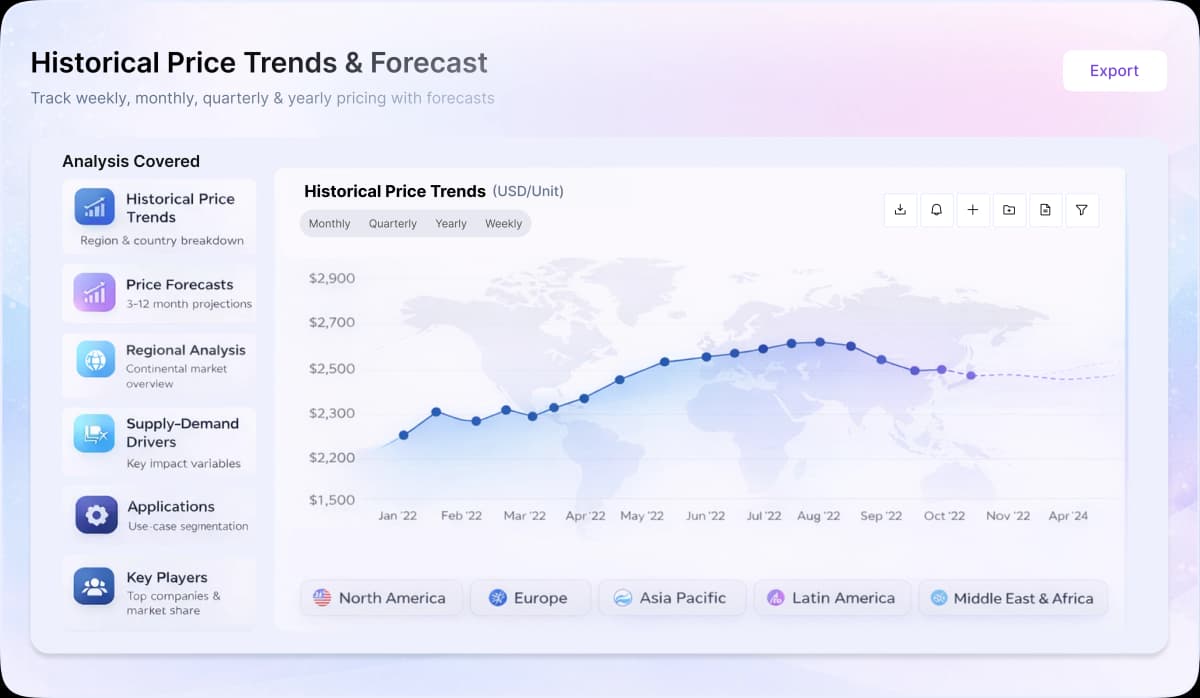
Turn price intelligence into action with the Procurement Resource Database. Log in or subscribe to unlock live price trends, historical charts, supplier databases, cost curves, and analyst-backed insights across chemicals, agriculture, energy, packaging, and more. Use these tools to benchmark your contracts, plan budgets with confidence, and stay ahead of market moves on every product you buy.

0

+

Products

0

+

Regions

0

+

Subscriptions

About Drawn Bar

Drawn bar is a precision-finished stainless steel long product produced by pulling hot-rolled or annealed bar through a die to obtain tighter dimensional tolerances, smoother surfaces, and improved straightness. Grade 304 is widely selected for general corrosion resistance and fabrication, whereas grade 316 contains molybdenum for better resistance in chloride-bearing environments. Drawn bars are supplied in round, square, hexagonal, and other sections for machining and engineered components.

Drawn Bar Product Detail

HS Code
7215
Supplier Database

Acerinox S.A., Aperam S.A., ArcelorMittal S.A., Carpenter Technology Corporation, Daido Steel Co. Ltd., JFE Steel Corporation, Nippon Steel Corporation, Outokumpu Oyj, POSCO Holdings, Valbruna Stainless Inc.

Synonyms

Stainless steel drawn bar, cold-drawn stainless steel bar, precision stainless steel bar.

Regional Coverage

Asia Pacific

China, India, Indonesia, Pakistan, Bangladesh, Japan, Philippines, Vietnam, Iran, Thailand, South Korea, Iraq, Saudi Arabia, Malaysia, Nepal, Taiwan, Sri Lanka, UAE, Israel, Hongkong, Singapore, Oman, Kuwait, Qatar, Australia, and New Zealand

Europe

Germany, France, United Kingdom, Italy,Spain, Russia, Turkey, Netherlands, Poland, Sweden, Belgium, Austria, Ireland Switzerland, Norway, Denmark, Romania, Finland, Czech Republic, Portugal and Greece

North America

United States and Canada

Latin America

Brazil, Mexico, Argentina, Columbia, Chile, Ecuador, and Peru

Africa

South Africa, Nigeria, Egypt, Algeria, Morocco

CurrencyUS$ (Data can also be provided in local currency)

Supplier Database AvailabilityYes

Customization ScopeThe report can be customized as per the requirements of the customer

Post-Sale Analyst Support360-degree analyst support after report delivery

Note: Our supplier search experts can assist your procurement teams in compiling and validating a list of suppliers indicating they have products, services, and capabilities that meet your company's needs.

Production Process

Drawn Bar Production by Cold Drawing : Production begins with stainless steel billets or hot-rolled bars, which are descaled and prepared for finishing. The material is annealed when required, lubricated, and pulled through one or more drawing dies to reduce its cross-section and improve dimensional accuracy. Grades 304 and 316 are processed under controlled conditions to maintain their properties. The drawn bar is then straightened, cut, polished or ground as specified, inspected, and tested before dispatch.

Industrial Uses

Stainless steel drawn bars are used for shafts, fasteners, pins, valve parts, pump components, machine tools, fittings, food-processing equipment, and architectural hardware. Grade 304 is common in general engineering, automotive, food, and construction applications where good corrosion resistance and machinability are required. Grade 316 is preferred for marine, chemical-processing, pharmaceutical, and other corrosive services because its molybdenum content improves resistance to pitting and chloride attack.

Our Price Analysis Methodology

About the Author

Pragati Agarwal profile photo

Pragati Agarwal

Senior Business Insights Analyst

Delivering price trend analysis and procurement market insights at Procurement Resource, with expertise in identifying commodity patterns, supporting purchasing strategies, and improving cost efficiency through actionable market intelligence.

Schedule Demo

Schedule A Demo

Experience how Procurement Resource transforms raw material price data into clear, decision ready intelligence. Optimise your performance with reliable, expert market data and analysis. Schedule your demo today to experience a live walk-through where our experts will showcase interactive price charts, forecasted prices, and insights driving the prices for your key commodities, tailored to your workflows. Contact us now!

Our Team will be happy to assist you

We are just a text away

+1

Still Need Help?

Europe & Africa

+44 7573 171117

[email protected]

USA & Canada

+1 307 363 1045

[email protected]

APAC

+91 8850629517

[email protected]

Unlock full access to Procurement Resource's price databases, interactive charts, and short-term forecasts for thousands of commodities. Elevate your sourcing decisions by comparing prices across regions, downloading historical data, and layering in analyst-backed insights, all with our flexible plans that scale as your portfolio grows.

Still have any Questions

Contact Us
Mastercard
Wire
VISA
Stripe

Why Procurement Database

Commodity Market Intelligence

Commodity Market Intelligence

Track prices, market movements, supply-demand dynamics, and industry developments across hundreds of commodities through a centralized intelligence platform built for informed procurement decisions.

Price Forecasts & Market Outlooks

Price Forecasts & Market Outlooks

Understand market fluctuations using analyst-backed forecasts, historical pricing patterns, and evolving industry trends to strengthen sourcing strategies and budget planning.

Cost & Procurement Optimization

Cost & Procurement Optimization

Leverage cost models, pricing benchmarks, and procurement insights to evaluate purchasing opportunities, improve negotiations, and enhance operational efficiency.

Global & Regional Market Insights

Global & Regional Market Insights

Access region-specific price trends, trade activities, capacity changes, and supply chain developments influencing commodity markets worldwide.

1/4