Carbonic Acid Price Trend Analysis 2026: Historical Prices, Latest News, Supply Demand Analysis, Market Insights & Price Drivers

Pragati Agarwal profile photo
Written ByPragati Agarwal

Procurement Resource Database

Laptop screen

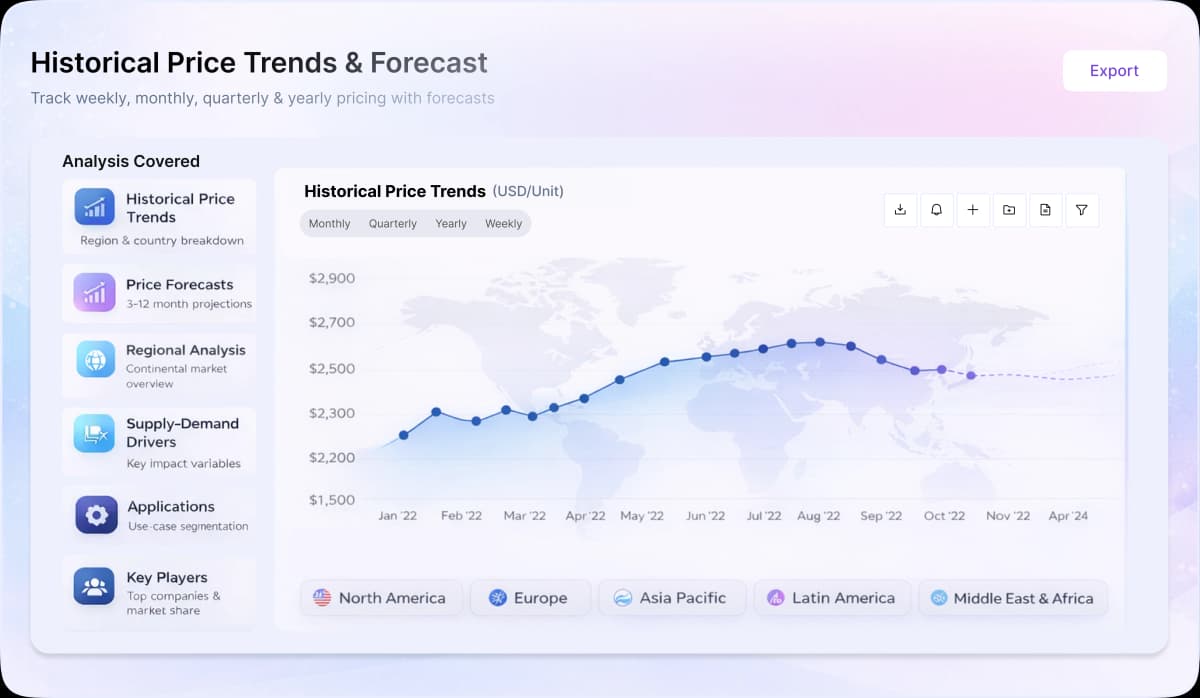
Turn price intelligence into action with the Procurement Resource Database. Log in or subscribe to unlock live price trends, historical charts, supplier databases, cost curves, and analyst-backed insights across chemicals, agriculture, energy, packaging, and more. Use these tools to benchmark your contracts, plan budgets with confidence, and stay ahead of market moves on every product you buy.

0

+

Products

0

+

Regions

0

+

Subscriptions

The market for Carbonic Acid experienced fluctuating pricing dynamics throughout the year, largely driven by movements in carbon dioxide, the primary feedstock used in its hydrolysis-based production process. Early in the year, prices increased as steady demand from beverage carbonation, food processing, and industrial applications provided support. Infrastructure projects and manufacturing activities contributed to consistent consumption patterns, while logistics constraints created supply tightness that drove prices upward across several markets.

As the year progressed, prices started easing with weakening demand, particularly from plastics and construction sectors that utilize carbonic acid derivatives. Supply conditions improved, though rising energy costs affected production economics. The middle months brought steady price movement with slight upward trends, supported by consistent industrial demand. However, export complications and trade-related uncertainties caused periodic fluctuations in feedstock availability.

Later in the year, prices remained mostly firm owing to steady demand from plastics and textile industries. Regulatory developments affecting carbon dioxide production and environmental compliance kept market participants alert regarding possible supply adjustments. Overall, the market displayed moderate volatility throughout the year, with pricing largely tracking carbon dioxide availability and downstream consumption patterns.


About Carbonic Acid

Carbonic acid (H2CO3) is a weak acid formed when carbon dioxide (CO2) dissolves in water, a reaction crucial in many biological and environmental processes. It plays a pivotal role in the carbon cycle and the acidification of oceans. Industrially, it's used in the beverage industry for carbonation and in water treatment for maintaining pH levels. In medicine, carbonic acid helps stabilize the pH of blood. Its instability means it decomposes quickly into water and CO2 in many conditions.



Carbonic Acid Product Detail

Chemical Formula

H2CO3

CAS Number
463-79-6
Molecular Weight
62.02 g/mol
Industrial Uses

Beverages, Water Treatment, Fire Safety Industry, Pharmaceuticals, Food Processing

Supplier Database

Shandong Shida Shenghua Chemical Group, Liaoyang Best Group, Yingkou Hengyang New Energy Chemical, Liaoning Huifu Chemical, Haike Group, Mitsui Fine Chemicals

Regional Coverage

Asia Pacific

China, India, Indonesia, Pakistan, Bangladesh, Japan, Philippines, Vietnam, Iran, Thailand, South Korea, Iraq, Saudi Arabia, Malaysia, Nepal, Taiwan, Sri Lanka, UAE, Israel, Hongkong, Singapore, Oman, Kuwait, Qatar, Australia, and New Zealand

Europe

Germany, France, United Kingdom, Italy,Spain, Russia, Turkey, Netherlands, Poland, Sweden, Belgium, Austria, Ireland Switzerland, Norway, Denmark, Romania, Finland, Czech Republic, Portugal and Greece

North America

United States and Canada

Latin America

Brazil, Mexico, Argentina, Columbia, Chile, Ecuador, and Peru

Africa

South Africa, Nigeria, Egypt, Algeria, Morocco

CurrencyUS$ (Data can also be provided in local currency)

Supplier Database AvailabilityYes

Customization ScopeThe report can be customized as per the requirements of the customer

Post-Sale Analyst Support360-degree analyst support after report delivery

Note: Our supplier search experts can assist your procurement teams in compiling and validating a list of suppliers indicating they have products, services, and capabilities that meet your company's needs.

Carbonic Acid Production Process

  • Carbonic Acid Production by the hydrolysis of carbon dioxide and water.

The chemical reaction of strong acids such as HCl or sulfuric acid along with calcium carbonate releases carbon dioxide gas. The resultant undergoes hydrolysis in the presence of water, which leads to the production of carbonic acid as the end product.

Frequently Asked Questions

The carbonic acid outlook for 2026 points to relatively stable prices, with adequate carbon dioxide availability and steady demand from beverage, water-treatment, and food-processing sectors keeping the market broadly balanced. European markets are likely to carry a relative premium amid tighter supply discipline and compliance-related sourcing caution, while Asian markets hold firm on consistent industrial offtake. Elevated energy costs will continue to shape production economics. Any meaningful price deviation would most likely stem from upstream gas supply disruptions or evolving environmental regulation.
CO2 feedstock dynamics are the central driver of carbonic acid prices, since the acid is produced by infusing CO2 into water under pressure. Upstream maintenance and logistics frictions can trim CO2 output and tighten supply, firming prices, while improved CO2 production and comfortable inventories tend to ease tightness. Seasonal demand from beverage carbonation and food-processing buyers provides a recurring support factor. Elevated energy costs add a further layer of sustained upward pressure on production economics.
China is the dominant production base, with several Chinese producers, including Shandong Shida Shenghua Chemical Group, Liaoyang Best Group, Yingkou Hengyang New Energy Chemical, Liaoning Huifu Chemical, and Haike Group, indicating meaningful supply concentration. European manufacturers include Linde AG, AIR LIQUIDE, CARBO Kohlensäurewerke, and FREYCO, while India's Triveni Chemicals, Nakoda Corporation, and Vizag Chemicals, and Japan's Mitsui Fine Chemicals also produce. Consumption spans Asia Pacific, Europe, and North America, anchored by beverage, food-processing, and pharmaceutical demand.
Produced through hydrolysis, carbonic acid uses CO2 and water as primary feedstocks. CO2 is sourced as a byproduct from ammonia and hydrogen production, brewery fermentation, or fossil fuel combustion, then dissolved in water to form H2CO3. The product serves food and beverage (carbonated drinks, sparkling wines, beer), chemical industry (ammonium salt precipitation), water treatment (pH control), pharmaceuticals (blood pH stabilization, contact lens solutions), cosmetology (skin treatments), and medical applications (carbonic baths for hypertension patients).
The beverage industry is the dominant demand driver for carbonic acid, with carbonation of sparkling wine, carbonated water, and aerated drinks providing the most consistent offtake. Food processing, pharmaceuticals, and water treatment also underpin steady industrial pull, while cosmetology applications in skin treatments add a growing niche. Together, these sectors translate into firm-to-range-bound pricing, with any meaningful price deviation most likely triggered by upstream carbon dioxide supply disruptions rather than shifts in downstream consumption.
Procurement Resource assesses carbonic acid prices through a structured, data-driven methodology combining direct engagement with producers, suppliers and traders, secondary market data, continuous monitoring of feedstock and input costs, trade-flow and inventory tracking, and exchange or spot benchmarks. This approach is validated and translated into a transparent price assessment and outlook. The detailed methodology is available on the Procurement Resource website.

Our Price Analysis Methodology

About the Author

Pragati Agarwal profile photo

Pragati Agarwal

Senior Business Insights Analyst

Delivering price trend analysis and procurement market insights at Procurement Resource, with expertise in identifying commodity patterns, supporting purchasing strategies, and improving cost efficiency through actionable market intelligence.

Schedule Demo

Schedule A Demo

Experience how Procurement Resource transforms raw material price data into clear, decision ready intelligence. Optimise your performance with reliable, expert market data and analysis. Schedule your demo today to experience a live walk-through where our experts will showcase interactive price charts, forecasted prices, and insights driving the prices for your key commodities, tailored to your workflows. Contact us now!

Our Team will be happy to assist you

We are just a text away

+1

Still Need Help?

Europe & Africa

+44 7573 171117

Sales@procurementresource.com

USA & Canada

+1 307 363 1045

Sales@procurementresource.com

APAC

+91 8850629517

Sales@procurementresource.com

Unlock full access to Procurement Resource's price databases, interactive charts, and short-term forecasts for thousands of commodities. Elevate your sourcing decisions by comparing prices across regions, downloading historical data, and layering in analyst-backed insights, all with our flexible plans that scale as your portfolio grows.

Still have any Questions

Contact Us
Mastercard
Wire
VISA
Stripe

Why Procurement Database

Commodity Market Intelligence

Commodity Market Intelligence

Track prices, market movements, supply-demand dynamics, and industry developments across hundreds of commodities through a centralized intelligence platform built for informed procurement decisions.

Price Forecasts & Market Outlooks

Price Forecasts & Market Outlooks

Understand market fluctuations using analyst-backed forecasts, historical pricing patterns, and evolving industry trends to strengthen sourcing strategies and budget planning.

Cost & Procurement Optimization

Cost & Procurement Optimization

Leverage cost models, pricing benchmarks, and procurement insights to evaluate purchasing opportunities, improve negotiations, and enhance operational efficiency.

Global & Regional Market Insights

Global & Regional Market Insights

Access region-specific price trends, trade activities, capacity changes, and supply chain developments influencing commodity markets worldwide.

1/4