Dysprosium Price Trend Analysis 2026: Historical Prices, Latest News, Price Drivers, Market Insights & Supply Demand Analysis

Rakesh Nandi profile photo
Written ByRakesh Nandi

Procurement Resource Database

Laptop screen

Turn price intelligence into action with the Procurement Resource Database. Log in or subscribe to unlock live price trends, historical charts, supplier databases, cost curves, and analyst-backed insights across chemicals, agriculture, energy, packaging, and more. Use these tools to benchmark your contracts, plan budgets with confidence, and stay ahead of market moves on every product you buy.

0

+

Products

0

+

Regions

0

+

Subscriptions

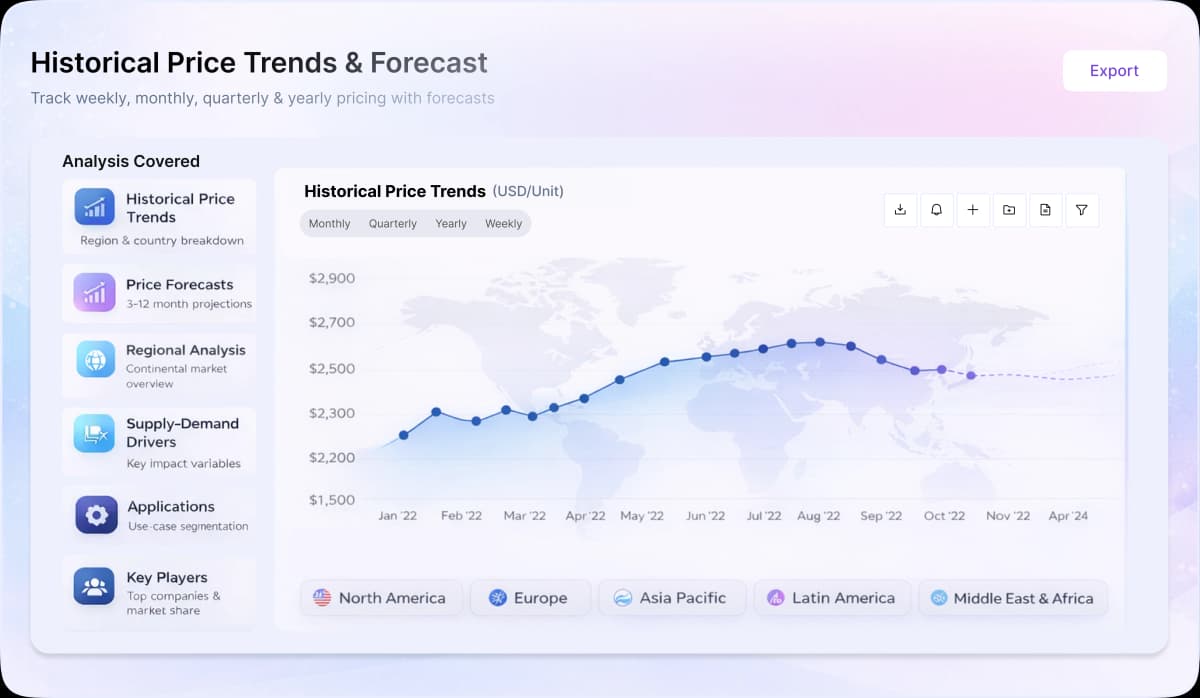
In the second half of 2024, Dysprosium prices followed a volatile pattern. The market experienced significant downward pressure during the summer months, primarily due to subdued demand from the new energy vehicle sector. However, by late Q3, prices showed signs of stabilization as downstream magnetic material manufacturers maintained steady purchasing patterns.

The fourth quarter witnessed notable price fluctuations. October began with relatively stable prices, but November saw a distinct downward trend across both dysprosium oxide and metal variants. This decline was particularly pronounced in late November when prices hit lower levels across all dysprosium products, including oxides, metals, and ferroalloys.

The market dynamics were largely influenced by a polarized demand situation. While major manufacturers in the permanent magnet sector maintained robust order books, smaller players struggled with weak demand and cautious purchasing behaviour. The supply situation became more complex due to disruptions from Myanmar, which created some upward price pressure despite the overall bearish sentiment.


About Dysprosium

Dysprosium is known as a chemical element. It is one of the rare elements with a metallic silver luster. It is found in numerous minerals, like xenotime. Naturally occurring dysprosium is made of 7 isotopes, the most abundant of which is 164Dy. It is widely utilised for its high thermal-neutron absorption cross-section in making control rods in nuclear reactors for the high magnet susceptibility of reactor.


Dysprosium Product Detail

Chemical Formula

Dy

Molecular Weight
162.5 g/mol
Industrial Uses

Medium source rare-earth lamps (MSRs), Alloys for neodymium-based magnets, Nuclear reactor control rods

Synonyms

7429-91-6, Dysprosium Metal

Supplier Database

American Elements, Northern Minerals Limited, Ucore Rare Metals Inc.

Regional Coverage

Asia Pacific

China, India, Indonesia, Pakistan, Bangladesh, Japan, Philippines, Vietnam, Iran, Thailand, South Korea, Iraq, Saudi Arabia, Malaysia, Nepal, Taiwan, Sri Lanka, UAE, Israel, Hongkong, Singapore, Oman, Kuwait, Qatar, Australia, and New Zealand

Europe

Germany, France, United Kingdom, Italy,Spain, Russia, Turkey, Netherlands, Poland, Sweden, Belgium, Austria, Ireland Switzerland, Norway, Denmark, Romania, Finland, Czech Republic, Portugal and Greece

North America

United States and Canada

Latin America

Brazil, Mexico, Argentina, Columbia, Chile, Ecuador, and Peru

Africa

South Africa, Nigeria, Egypt, Algeria, Morocco

CurrencyUS$ (Data can also be provided in local currency)

Supplier Database AvailabilityYes

Customization ScopeThe report can be customized as per the requirements of the customer

Post-Sale Analyst Support360-degree analyst support after report delivery

Note: Our supplier search experts can assist your procurement teams in compiling and validating a list of suppliers indicating they have products, services, and capabilities that meet your company's needs.

Dysprosium Production Process

  • Production of Dysprosium via Extraction from Monazite Sand.

It is derived mainly from monazite sand via ion exchange process and solvent extraction process. Another way of extracting Dysprosium is via reduction of dysprosium trifluoride with calcium.

Frequently Asked Questions

The dysprosium outlook remains structurally tight, with prices supported by periodic Chinese export controls on medium-heavy rare earths and the country's dominant ~85% share of global processing capacity. The divergence that can open between stable domestic Chinese pricing and surging overseas values signals persistent supply risk for international buyers. Limited ore availability from Myanmar and seasonal Southeast Asian supply challenges add further uncertainty. A relaxation of export controls or successful development of alternative processing capacity would be the key conditions that could ease the outlook.
Dysprosium mining relies on monazite ore from Australia, Brazil, India, and China, but China dominates processing at roughly 85% of global capacity through companies like China Northern Rare Earth Group and Ganzhou Goring. Chinese export controls on medium-heavy rare earths have at times caused European dysprosium oxide prices to surge nearly threefold within a month while domestic prices stayed stable, exposing international buyers' structural dependency on a single processing hub. Limited ore supply from Myanmar and Southeast Asia adds further fragility.
Chinese export controls on heavy rare earth elements, including dysprosium, are a dominant price driver given China's roughly 85% share of global rare earth processing capacity. Such restrictions can compress overseas supply, pushing European dysprosium oxide values up sharply within a short period, while domestic Chinese pricing stays comparatively stable, creating a sharp geographic price gap. Limited rare earth ore availability from Myanmar and seasonal disruptions across Southeast Asia further constrain supply, leaving international buyers with few alternative sources and amplifying any price spike.
Dysprosium production is highly concentrated, with China controlling roughly 85% of rare earth processing capacity through China Northern Rare Earth Group, Shenghe Resources, and Ganzhou Goring. Lynas Rare Earths processes ore in Australia and Malaysia, while Hindustan Oxides & Minerals, American Elements, and Ucore Rare Metals are also active. Monazite ore is sourced from Australia, Brazil, India, and China. Europe and North America are the largest importers, driven by EV motors, wind turbines, and defense applications.
Dysprosium demand is driven by the electric vehicle, wind turbine, electronics, and nuclear power sectors. EV and wind turbine manufacturers use it as an alloy additive in neodymium-based magnets to prevent high-temperature demagnetization. Electronics makers use it in medium-source rare-earth lamps, while nuclear operators rely on it in control rods for neutron absorption. Growth in EV production and renewable energy capacity expansion lifts procurement volumes, while nuclear programme activity supports steady baseline demand. Sector expansions push prices upward; slowdowns in EV or wind turbine output ease procurement pressure.
Procurement Resource assesses dysprosium prices through a structured, data-driven methodology built on direct engagement with producers, suppliers, and traders across key regions. Primary intelligence is combined with secondary market data, continuous monitoring of feedstock and input costs, trade-flow and inventory tracking, and exchange or spot benchmarks. Each data point is validated and cross-checked into a transparent price assessment reflecting current market conditions. The resulting outlook integrates supply-side dynamics, downstream demand patterns, and policy developments to give procurement professionals a reliable basis for strategic sourcing decisions.

Our Price Analysis Methodology

About the Author

Rakesh Nandi profile photo

Rakesh Nandi

Team Lead - Market Research

Leading procurement-focused market intelligence across chemicals, composites, advanced materials, aerospace & defense, and energy, delivering commodity forecasts, supply chain analysis, and competitive benchmarking to support sourcing decisions.

Schedule Demo

Schedule A Demo

Experience how Procurement Resource transforms raw material price data into clear, decision ready intelligence. Optimise your performance with reliable, expert market data and analysis. Schedule your demo today to experience a live walk-through where our experts will showcase interactive price charts, forecasted prices, and insights driving the prices for your key commodities, tailored to your workflows. Contact us now!

Our Team will be happy to assist you

We are just a text away

+1

Still Need Help?

Europe & Africa

+44 7573 171117

[email protected]

USA & Canada

+1 307 363 1045

[email protected]

APAC

+91 8850629517

[email protected]

Other Related Reports

Carbon Monoxide Production from Metal Oxides

The report revolves around the cost analysis of production of carbon monoxide as a byproduct of the reduction of metal oxide ores with carbon.

Ammonium Nitrate Production from Metal Nitrates

The report is a detailed cost analysis of production of ammonium nitrate by a typical metathesis reaction.

Unlock full access to Procurement Resource's price databases, interactive charts, and short-term forecasts for thousands of commodities. Elevate your sourcing decisions by comparing prices across regions, downloading historical data, and layering in analyst-backed insights, all with our flexible plans that scale as your portfolio grows.

Still have any Questions

Contact Us
Mastercard
Wire
VISA
Stripe

Related News

View All

Why Procurement Database

Commodity Market Intelligence

Commodity Market Intelligence

Track prices, market movements, supply-demand dynamics, and industry developments across hundreds of commodities through a centralized intelligence platform built for informed procurement decisions.

Price Forecasts & Market Outlooks

Price Forecasts & Market Outlooks

Understand market fluctuations using analyst-backed forecasts, historical pricing patterns, and evolving industry trends to strengthen sourcing strategies and budget planning.

Cost & Procurement Optimization

Cost & Procurement Optimization

Leverage cost models, pricing benchmarks, and procurement insights to evaluate purchasing opportunities, improve negotiations, and enhance operational efficiency.

Global & Regional Market Insights

Global & Regional Market Insights

Access region-specific price trends, trade activities, capacity changes, and supply chain developments influencing commodity markets worldwide.

1/4