EU Corn Production Forecast Cut
European Commission lowered the 2026/27 corn production forecast by 1.3 million tonnes, tightening supply outlook. The reduction may increase demand for imports, potentially lifting corn prices.

European Commission lowered the 2026/27 corn production forecast by 1.3 million tonnes, tightening supply outlook. The reduction may increase demand for imports, potentially lifting corn prices.
Corn prices at Black Sea ports in Romania and Bulgaria increased, while Ukrainian corn fell due to new‑crop supplies and limited export opportunities. Global corn futures eased, reflecting stronger harvest progress and lower export shipments.
| Product | Region | Incoterm Basis | Price | Last Updated Month |
|---|---|---|---|---|
| Polylactic Acid (PLA) | USA | EXW | USD 2,422.00/MT | August 2026 |
| Polylactic Acid (PLA) | China | EXW | USD 2,288.00/MT | August 2026 |
| Polylactic Acid (PLA) | Europe | EXW | USD 2,818.00/MT | August 2026 |
| Polylactic Acid (PLA) | South East Asia | EXW | USD 2,378.00/MT | August 2026 |
| Polylactic Acid (PLA) | Latin America | EXW | USD 2,690.00/MT | August 2026 |
| Polylactic Acid (PLA) | USA | EXW | USD 2,410.00/MT | July 2026 |
| Polylactic Acid (PLA) | China | EXW | USD 2,270.00/MT | July 2026 |
| Polylactic Acid (PLA) | Europe | EXW | USD 2,790.00/MT | July 2026 |
| Polylactic Acid (PLA) | South East Asia | EXW | USD 2,350.00/MT | July 2026 |
| Polylactic Acid (PLA) | Latin America | EXW | USD 2,650.00/MT | July 2026 |
Stay updated with the latest Polylactic Acid (PLA) prices, historical data, and tailored regional analysis
Asia
In the first half of 2025, the PLA market in Asia, particularly China, showed a fluctuating trend. At the start of the year, prices increased due to strong demand recovery after the Lunar New Year and limited supply from earlier production cuts. However, by late January, the market began to soften as fresh production capacities came online, easing supply constraints.
February saw a brief rebound supported by packaging and agricultural demand, but rising competition from other biodegradable plastics and lower downstream activity in March caused prices to slip again. Oversupply and improved logistics in the region further contributed to downward pressure. Overall, prices in Asia declined across the half-year, despite early signs of strength.
Europe
In Europe, PLA prices steadily increased during H1’25. The region experienced strong demand from packaging and agriculture, driven by new EU regulations favoring biodegradable materials. Rising raw material costs and tighter production capacity added to the bullish trend. Congestion at key ports, particularly Rotterdam, created supply delays that further strained availability and pushed prices up.
The continued implementation of green policies and incentives for compostable packaging supported firm consumption across sectors like food packaging and 3D printing. Despite some market pushback on higher prices, steady demand and limited supply allowed prices to maintain an upward trajectory throughout the first half.
North America
PLA prices in North America remained largely stable during H1’25. While early January started off balanced, mid-quarter brought slight downward movement due to oversupply and slower post-holiday demand. However, by March, market conditions improved as demand for sustainable packaging rebounded, supported by government and industry efforts to promote eco-friendly alternatives.
Still, rising import costs and tariffs on Chinese materials created uncertainty, limiting significant price movement. The market remained resilient, with no drastic shifts seen through June.
Analyst Insight
According to Procurement Resource, global Polylactic Acid prices may face continued regional divergence. Europe is expected to see ongoing price strength, while Asia and North America may remain more stable, depending on supply-demand balance and trade policies.
Need Latest Polylactic Acid (PLA) Prices?
Get real-time price assessments, periodic trends, forecasts and price driver insights across key global markets.
Our Clients































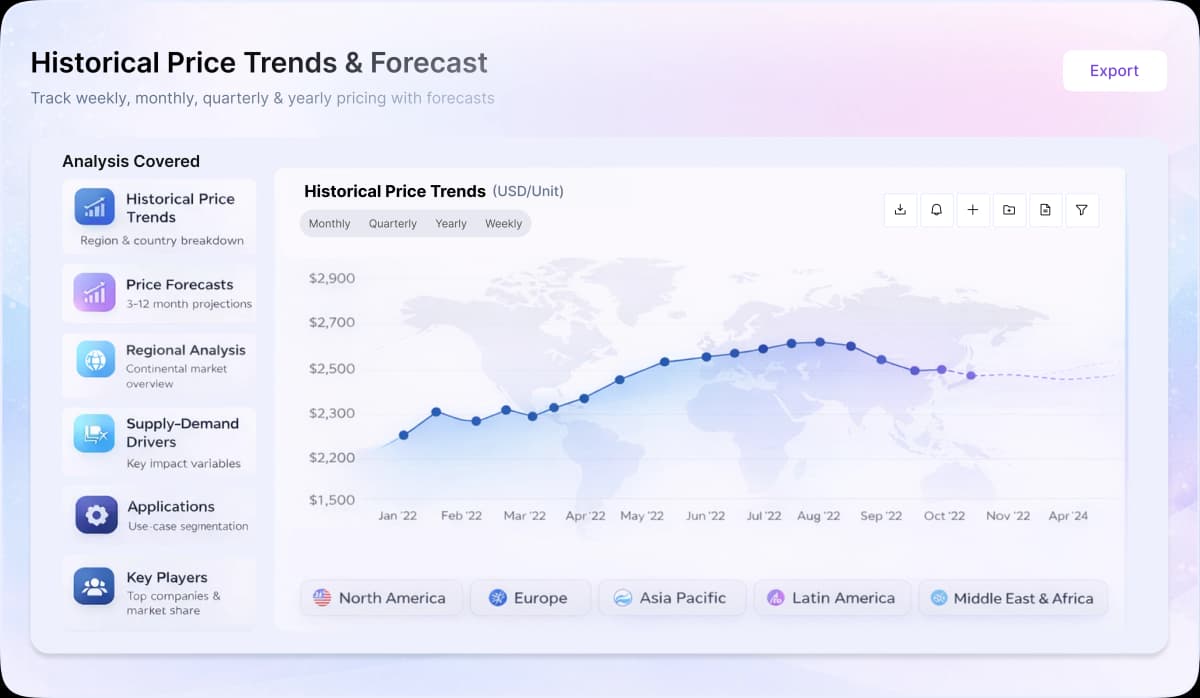
Turn price intelligence into action with the Procurement Resource Database. Log in or subscribe to unlock live price trends, historical charts, supplier databases, cost curves, and analyst-backed insights across chemicals, agriculture, energy, packaging, and more. Use these tools to benchmark your contracts, plan budgets with confidence, and stay ahead of market moves on every product you buy.
0
+Products
0
+Regions
0
+Subscriptions
Asia
In Q4’24, Asia’s PLA market remained stable despite raw material challenges, especially with corn starch prices. Producers in China and Thailand maintained steady production, but some supply chain disruptions, including delayed shipments, created minor volatility.
Strong demand from the packaging sector, driven by growing consumer preference for sustainable materials, helped keep prices stable, despite higher input costs.
Europe
In Europe, the PLA market showed resilience, particularly in Germany, where demand from the packaging industry remained strong due to regulatory pushes for sustainability. However, economic slowdowns and supply chain challenges, such as port congestion and delayed raw material shipments, created some pricing pressures. Despite these hurdles, the demand for eco-friendly solutions like PLA supported price stability.
North America
North America saw steady PLA demand in Q4’24, especially from the food & beverage sector, where there was growing interest in bioplastics. However, rising corn starch costs and logistical issues, including container shortages and delays, put some pressure on production costs. Despite these challenges, the market remained relatively stable due to the continued preference for sustainable packaging solutions.
Polylactic Acid (PLA) is a thermoplastic biopolymer belonging to the class of polyesters. It is obtained from the polymerization of lactic acid to produce the repeating units. PLA has the second highest consumption volume of bioplastics globally and is easily obtained from renewable feedstocks such as sugarcane, corn, or tapioca. It has high tensile strength, low thermal expansion and high heat resistance when annealed.
(C3H4)O2)n
Pharmaceuticals, Disposable Tableware, Upholstery, Mulch Films, 3-D Printing
PLA, Polylactide
Evonik, NatureWorks, Futerro, Sulzer, Total-Corbion
CurrencyUS$ (Data can also be provided in local currency)
Supplier Database AvailabilityYes
Customization ScopeThe report can be customized as per the requirements of the customer
Post-Sale Analyst Support360-degree analyst support after report delivery
Note: Our supplier search experts can assist your procurement teams in compiling and validating a list of suppliers indicating they have products, services, and capabilities that meet your company's needs.
Sequential melt–solid polycondensation of lactic acid in the presence of a suitable catalyst produces high molecular weight polylactic acid. This process is usually carried out at high temperatures and at reduced pressure.
Our Price Analysis Methodology

AVP - Strategy and Solutions
Leading procurement research solutions across chemicals, materials, and food & beverages, with expertise in price forecasting and market analytics.
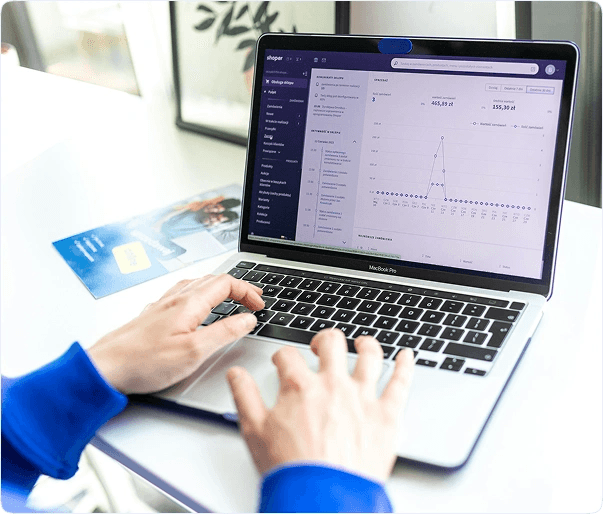
Experience how Procurement Resource transforms raw material price data into clear, decision ready intelligence. Optimise your performance with reliable, expert market data and analysis. Schedule your demo today to experience a live walk-through where our experts will showcase interactive price charts, forecasted prices, and insights driving the prices for your key commodities, tailored to your workflows. Contact us now!
Our Team will be happy to assist you
We are just a text away
Still Need Help?
This report provides the cost structure of polylactic acid production by melt-phase polymerization method.
Unlock full access to Procurement Resource's price databases, interactive charts, and short-term forecasts for thousands of commodities. Elevate your sourcing decisions by comparing prices across regions, downloading historical data, and layering in analyst-backed insights, all with our flexible plans that scale as your portfolio grows.
Still have any Questions
Contact Us



Price Trend Dashboard - What's Included
Price trends across a diverse portfolio of categories and products, spanning board to niche chemicals
Coverage extendable to grade-specific chemicals based on procurement requirements
Regular price tracking supported by robust historical datasets
News, policy updates, and key market drivers impacting price movements
Short-term and long-term price outlooks and forecasts
Supply–demand dynamics and capacity-driven market analysis

Track prices, market movements, supply-demand dynamics, and industry developments across hundreds of commodities through a centralized intelligence platform built for informed procurement decisions.

Understand market fluctuations using analyst-backed forecasts, historical pricing patterns, and evolving industry trends to strengthen sourcing strategies and budget planning.

Leverage cost models, pricing benchmarks, and procurement insights to evaluate purchasing opportunities, improve negotiations, and enhance operational efficiency.
Access region-specific price trends, trade activities, capacity changes, and supply chain developments influencing commodity markets worldwide.


