

Udeesha Tomar
AVP - Strategy and Solutions
Leading procurement research solutions across chemicals, materials, and food & beverages, with expertise in price forecasting and market analytics.

Asia
In the Asia-Pacific region, purified isophthalic acid prices saw a significant upward trend in the first quarter of 2024. This surge was primarily due to supply disruptions caused by the shutdown of key toluene plants in major exporting provinces, exacerbated by the Chinese Lunar New Year festivities, which further tightened the market. The outcomes of the OPEC+ production policy meeting also contributed to market tensions, as production cuts were less than anticipated. This combination of supply shortages and increased demand led to a sharp rise in prices across the region.
Moving into the second quarter, the Asian purified isophthalic acid market remained buoyant. Tight supply conditions continued to support prices, and re-stocking activities in China ahead of the festival season provided additional momentum. The rising cost of feedstock xylene, driven by fluctuating crude oil market sentiments, further increased production costs, pushing prices higher. Despite global trade disruptions and escalating transportation charges, both domestic and international inquiries for purified isophthalic acid derivatives remained strong, reinforcing the market's upward trajectory.
Europe
In Europe, purified isophthalic acid prices also experienced an increase in the first quarter, driven by heightened demand from the downstream plasticizers market and reduced inventory levels due to increased consumption. However, supply chain disruptions, such as farmer protests and a rail strike in Germany, created uncertainties in the market. Rising feedstock prices and increasing production costs, compounded by supply shortages, led to higher purified isophthalic acid prices. As the quarter progressed, increased trading activities, particularly from Germany to overseas markets, further supported the price trend.
However, in the second quarter, the European purified isophthalic acid market did not share the same positive outlook as Asia. Prices fluctuated and ultimately settled at the lower end of the spectrum. Weak cost support from feedstock industries and muted demand from downstream sectors, especially the PET resin market, contributed to this subdued pricing trend. Despite a decline in Asian imports, the European market faced challenges in balancing supply and demand, leading to a lackluster performance.
North America
In North America, purified isophthalic acid prices saw a significant rise in the first quarter, influenced by sustained demand and higher costs for toluene and phthalic anhydride. Geopolitical tensions and potential US military involvement in the Middle East, alongside shipping route disruptions, further complicated the market. Supply chain constraints, particularly in raw materials, also played a role, with major toluene manufacturers operating under force majeure due to severe weather conditions. These factors provided strong cost support to the purified isophthalic acid market in the region.
The upward trend continued into the second quarter, resonating with the Asian market's dynamics. Shortages in import supply, coupled with rising ocean freight charges and longer lead times, pushed prices higher. Although demand from downstream PET industries was modest, the ongoing supply challenges and rising feedstock costs were sufficient to drive purified isophthalic acid prices upward throughout the quarter.
Analyst Insight
According to Procurement Resource, the price of Purified Isophthalic Acid is expected to continue its northwards trajectory under ample support from the feedstock as well as downstream industries.
Related Report
Need Latest Purified Isophthalic Acid (PIA) Prices?
Get real-time price assessments, periodic trends, forecasts and price driver insights across key global markets.
Our Clients































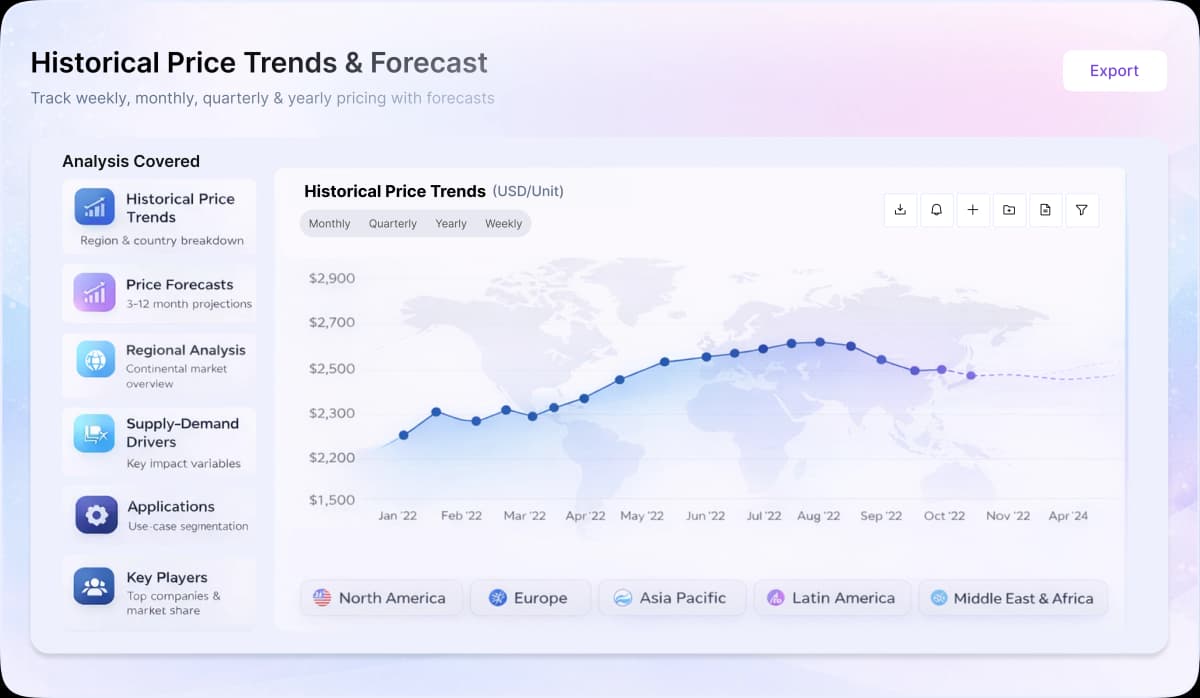
Turn price intelligence into action with the Procurement Resource Database. Log in or subscribe to unlock live price trends, historical charts, supplier databases, cost curves, and analyst-backed insights across chemicals, agriculture, energy, packaging, and more. Use these tools to benchmark your contracts, plan budgets with confidence, and stay ahead of market moves on every product you buy.
0
+Products
0
+Regions
0
+Subscriptions
Asia
Purified isophthalic acid (PIA) prices showcased an underwhelming performance during the second half of the year 2023. Quarter three began with lackluster demands from the downstream consuming sectors. The inventories were already stacked and overflowing with unused products. Still the feedstock paraxylene prices and the running oil costs were providing some upstream cost support. But as the crude oil prices dipped in the following quarter, the purified isophthalic acid prices also dived down.
The US Dollar also strengthened in the international market, which ticked inflation in several Asian markets. Overall, a declining trend was observed for purified isophthalic acid during the said time period.
Europe
The situation in the European purified isophthalic acid market was not very different from the Asian market, as the prices were found to be struggling here as well. Quarter three saw a considerable loss in customer interest, especially from the PET bottle industries. This started exerting a reverse pressure on inventories.
The manufacturers even reduced production to balance the parity between the supply and demand dynamics. So, the market rates maintained a downward trajectory. In the fourth quarter, other geopolitical disturbances also became pivotal in determining commodity prices. After the Russian war, the supply chains, especially for Europe, took another hit as the Israel and Hamas conflict erupted. Overall, a dipping trend was witnessed for PIA during H2’23.
North America
The market situation for PIA was not much different in the North American markets than in its Asian and European counterparts. The prices were observed to be sliding down here as well. Dull downstream demands were fundamentally the reason the performance remained unsatisfactory for the most part. Inventories were exhausted since the beginning of the third quarter. In the fourth quarter, a supply chain crisis was observed as the drought prolonged in the Panama Canal, hindering the passage of vessels. Still, the existing stocks could handle the existing demands.
Purified Isophthalic Acid has a little unpleasant odour. It is a colourless solid isomer of phtalic acid and tereohthalic acid. Isophthalic acid is a benzenedicarboxylic acid with carboxy groups at positions 1 and 3 substituting for benzene. It improves the clarity of bottles, thermal/mechanical/chemical resistance of unsaturated polyester resins and maintains the durability and weatherability of polyesters.
C8H6O4
Production of polyethylene terephthalate (PET) resin, Production of unsaturated polyester resin (UPR)
Benzene-1,3-dicarboxylic acid, m-Phthalic acid
Lotte Chemical, Eastman, SABIC, British Petroleum (BP), Total Petrochemicals
CurrencyUS$ (Data can also be provided in local currency)
Supplier Database AvailabilityYes
Customization ScopeThe report can be customized as per the requirements of the customer
Post-Sale Analyst Support360-degree analyst support after report delivery
Note: Our supplier search experts can assist your procurement teams in compiling and validating a list of suppliers indicating they have products, services, and capabilities that meet your company's needs.
The procedure involves using oxygen to oxidise m-xylene. After being separated as crude isophthalic acid, the generated isophthalic acid is then hydrogenated to produce refined isophthalic acid (PIA).
Our Price Analysis Methodology
AVP - Strategy and Solutions
Leading procurement research solutions across chemicals, materials, and food & beverages, with expertise in price forecasting and market analytics.
Experience how Procurement Resource transforms raw material price data into clear, decision ready intelligence. Optimise your performance with reliable, expert market data and analysis. Schedule your demo today to experience a live walk-through where our experts will showcase interactive price charts, forecasted prices, and insights driving the prices for your key commodities, tailored to your workflows. Contact us now!
Our Team will be happy to assist you
We are just a text away
Still Need Help?
Unlock full access to Procurement Resource's price databases, interactive charts, and short-term forecasts for thousands of commodities. Elevate your sourcing decisions by comparing prices across regions, downloading historical data, and layering in analyst-backed insights, all with our flexible plans that scale as your portfolio grows.
Still have any Questions
Contact Us



Price Trend Dashboard - What's Included
Price trends across a diverse portfolio of categories and products, spanning board to niche chemicals
Coverage extendable to grade-specific chemicals based on procurement requirements
Regular price tracking supported by robust historical datasets
News, policy updates, and key market drivers impacting price movements
Short-term and long-term price outlooks and forecasts
Supply–demand dynamics and capacity-driven market analysis

Track prices, market movements, supply-demand dynamics, and industry developments across hundreds of commodities through a centralized intelligence platform built for informed procurement decisions.

Understand market fluctuations using analyst-backed forecasts, historical pricing patterns, and evolving industry trends to strengthen sourcing strategies and budget planning.

Leverage cost models, pricing benchmarks, and procurement insights to evaluate purchasing opportunities, improve negotiations, and enhance operational efficiency.
Access region-specific price trends, trade activities, capacity changes, and supply chain developments influencing commodity markets worldwide.