Lead futures rise amid weaker dollar
Overnight trading saw SHFE lead gain and LME lead advance as the US dollar slipped. The move bucked a broader decline in most base metals, indicating supportive sentiment for lead prices.

Overnight trading saw SHFE lead gain and LME lead advance as the US dollar slipped. The move bucked a broader decline in most base metals, indicating supportive sentiment for lead prices.
Spot lead prices increased as circulating supply tightened and premiums widened. Smelters limited shipments and downstream buying remained cautious, supporting higher quotations.
| Product | Region | Incoterm Basis | Price | Last Updated Month |
|---|---|---|---|---|
| Lead | China | FOB | USD 2,340.79/MT | August 2026 |
| Lead | India | CIF | USD 2,431.58/MT | August 2026 |
| Lead | USA | CIF | USD 2,496.41/MT | August 2026 |
| Lead | Brazil | CIF | USD 2,483.22/MT | August 2026 |
| Lead | Canada | CIF | USD 2,506.79/MT | August 2026 |
| Lead | China | FOB | USD 2,321.40/MT | July 2026 |
| Lead | India | CIF | USD 2,428.21/MT | July 2026 |
| Lead | USA | CIF | USD 2,508.89/MT | July 2026 |
| Lead | Brazil | CIF | USD 2,455.03/MT | July 2026 |
| Lead | Canada | CIF | USD 2,518.40/MT | July 2026 |
Stay updated with the latest Lead prices, historical data, and tailored regional analysis
Asia
In China, the average price of Lead rose from ~USD 2,321.40/MT (FOB) in July to ~USD 2,340.79/MT in August, showing a small gain. India held nearly flat, with average import prices edging up about marginally from ~USD 2,428.21/MT (CIF) to ~USD 2,431.58/MT. Prices fell to their lowest in more than two years in mid-July, tracking a global selloff, as weak consumption expectations and rising ingot stocks weighed on the market. Large flows from India added to supply, with China's net refined lead imports reaching 190,000 tonnes in the first half of the year. From late July, smelter maintenance and production cuts tightened spot supply, and holiday restocking in September pushed smelter inventories to their lows.
Europe
European lead prices follow the LME, which dropped in July after large volumes of metal, mostly Indian brands, were delivered into Singapore warehouses, lifting exchange stocks. The market remained well supplied in August, with cash metal trading below forward prices. Global refined supply exceeded demand by about 49,000 tonnes in the first half of the year, adding pressure. Prices recovered slowly into late September as stocks fell and Chinese smelter constraints offered support.
North America
In the USA, average lead import prices eased from nearly USD 2,508.89/MT (CIF) in July to roughly USD 2,496.41/MT in August. Canada followed with a similar decline from ~USD 2,518.40/MT (CIF) to ~USD 2,506.79/MT. Regional prices tracked weaker LME values, as high exchange stocks kept global supply ample. Lower US mine output and reduced Mexican refined production limited declines, while large fund short positions weighed on sentiment.
Analyst Insight
According to Procurement Resource, lead prices are likely to firm slightly as smelter constraints and restocking offer support, though ample stocks and flat battery demand may limit gains.
Related Report
Need Latest Lead Prices?
Get real-time price assessments, periodic trends, forecasts and price driver insights across key global markets.
Our Clients































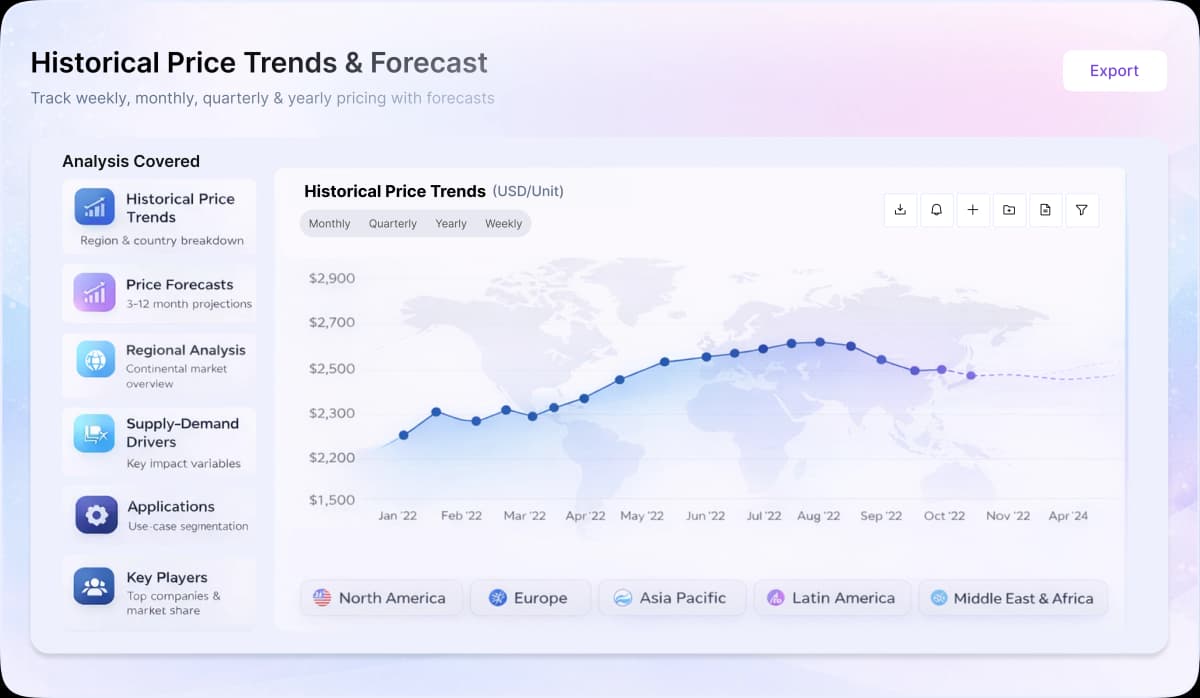
Turn price intelligence into action with the Procurement Resource Database. Log in or subscribe to unlock live price trends, historical charts, supplier databases, cost curves, and analyst-backed insights across chemicals, agriculture, energy, packaging, and more. Use these tools to benchmark your contracts, plan budgets with confidence, and stay ahead of market moves on every product you buy.
0
+Products
0
+Regions
0
+Subscriptions
Asia
In China, Lead prices were ~RMB 16.47/kg in April and ~RMB 16.40/kg in May, showing a marginal decrease. The market stayed weak because lead-acid battery demand entered the off-season, distributor inventories were high, and battery makers purchased only for immediate needs. Cost support came from tight concentrates and higher scrap battery costs, but it was not enough to lift prices. However, in India, Lead prices were ~INR 233.62/kg in April and ~INR 236.68/kg in May, showing a ~1.3% increase. India was supported by steadier battery-linked demand and tighter Southeast Asian availability, where secondary lead smelter operations were restricted and regional premiums increased.
Europe
During Q2'26, Lead moved slightly upward as tight availability in the European markets during the first two months of the quarter, but the market weakened in June as visible inventories stayed heavy. LME stocks moved from 281,700 tons on April 1 to 314,000 tons on May 29, before easing to 297,375 tons by June 30. Demand support was limited because refined lead consumption in Europe was expected to grow only modestly in 2026. Mine-output pressure from Sweden and weaker UK refined output offered some support, but the wider surplus and high stocks kept buyers cautious.
North America
In the United States, Lead prices were ~USD 2,498.65/MT in April and ~USD 2,543.10/MT in the subsequent month, showing a ~1.8% increase. North American lead market was better supported than China because battery demand stayed firmer. Lead-acid batteries remained the main demand base, covering automotive starter batteries, standby power, and motive power uses. Supply was still dependent on recycling and imports, as the U.S. has no primary lead refinery and nearly all mine concentrate is exported. This kept buyers sensitive to scrap battery availability and refined lead import costs.
In appearance, Lead is a metallic gray element which has many different applications. Being soft and malleable, it has low melting point. It is widely utilised in the production of batteries, fusible alloys, ammunition, metal products (solder and pipes), as well as in the devices to shield X-rays.
Pb
Batteries, Cable sheaths, Machinery manufacturing, ShipbuildingLight industry, Lead oxide, Radiation protection
7439-92-1, Plumbum
Umicore N.V, American Elements, Glencore plc, Korea Zinc Co., Ltd., The Doe Run Resources Corporation, Hindustan Zinc Limited
CurrencyUS$ (Data can also be provided in local currency)
Supplier Database AvailabilityYes
Customization ScopeThe report can be customized as per the requirements of the customer
Post-Sale Analyst Support360-degree analyst support after report delivery
Note: Our supplier search experts can assist your procurement teams in compiling and validating a list of suppliers indicating they have products, services, and capabilities that meet your company's needs.
The primary production of lead begins with the Sintering process, where concentrated lead ore is processed inside a sintering machine along with iron, silica, limestone fluxes, soda ash, pyrite, zinc, caustics or pollution control particulates. Smelting uitlises reduction substances, which are known for combining with the oxidising agents. Hence, reduction is the last step in this smelting process, which further produces elemental Lead.
Our Price Analysis Methodology

Senior Business Insights Analyst
Delivering price trend analysis and procurement market insights at Procurement Resource, with expertise in identifying commodity patterns, supporting purchasing strategies, and improving cost efficiency through actionable market intelligence.
Experience how Procurement Resource transforms raw material price data into clear, decision ready intelligence. Optimise your performance with reliable, expert market data and analysis. Schedule your demo today to experience a live walk-through where our experts will showcase interactive price charts, forecasted prices, and insights driving the prices for your key commodities, tailored to your workflows. Contact us now!
Our Team will be happy to assist you
We are just a text away
Still Need Help?
This study analyzes Lead Acetate Production from Elemental Lead, covering manufacturing, process flow, operating expenses, and financial considerations.
The study offers a detailed cost analysis of Lead Ingots Production from Lead Acid Batteries. In addition, the report incorporates the manufacturing process with detailed process and material flow, operating costs along with financial expenses and depreciation charges.
Copper Wire Manufacturing Plant Project Report thoroughly focuses on every detail that encompasses the cost of manufacturing. Our extensive cost model meticulously covers breaking down expenses around raw materials, labour, technology, and manufacturing expenses. This enables precise cost structure optimization and helps in identifying effective strategies to reduce the overall cash cost of manufacturing.
Unlock full access to Procurement Resource's price databases, interactive charts, and short-term forecasts for thousands of commodities. Elevate your sourcing decisions by comparing prices across regions, downloading historical data, and layering in analyst-backed insights, all with our flexible plans that scale as your portfolio grows.
Still have any Questions
Contact Us



Price Trend Dashboard - What's Included
Price trends across a diverse portfolio of categories and products, spanning board to niche chemicals
Coverage extendable to grade-specific chemicals based on procurement requirements
Regular price tracking supported by robust historical datasets
News, policy updates, and key market drivers impacting price movements
Short-term and long-term price outlooks and forecasts
Supply–demand dynamics and capacity-driven market analysis

Track prices, market movements, supply-demand dynamics, and industry developments across hundreds of commodities through a centralized intelligence platform built for informed procurement decisions.

Understand market fluctuations using analyst-backed forecasts, historical pricing patterns, and evolving industry trends to strengthen sourcing strategies and budget planning.

Leverage cost models, pricing benchmarks, and procurement insights to evaluate purchasing opportunities, improve negotiations, and enhance operational efficiency.
Access region-specific price trends, trade activities, capacity changes, and supply chain developments influencing commodity markets worldwide.


