Niacin Price Trend Analysis 2026: Historical Prices, Price Drivers, Latest News, Market Insights & Supply Demand Analysis

Procurement Resource Database

Laptop screen

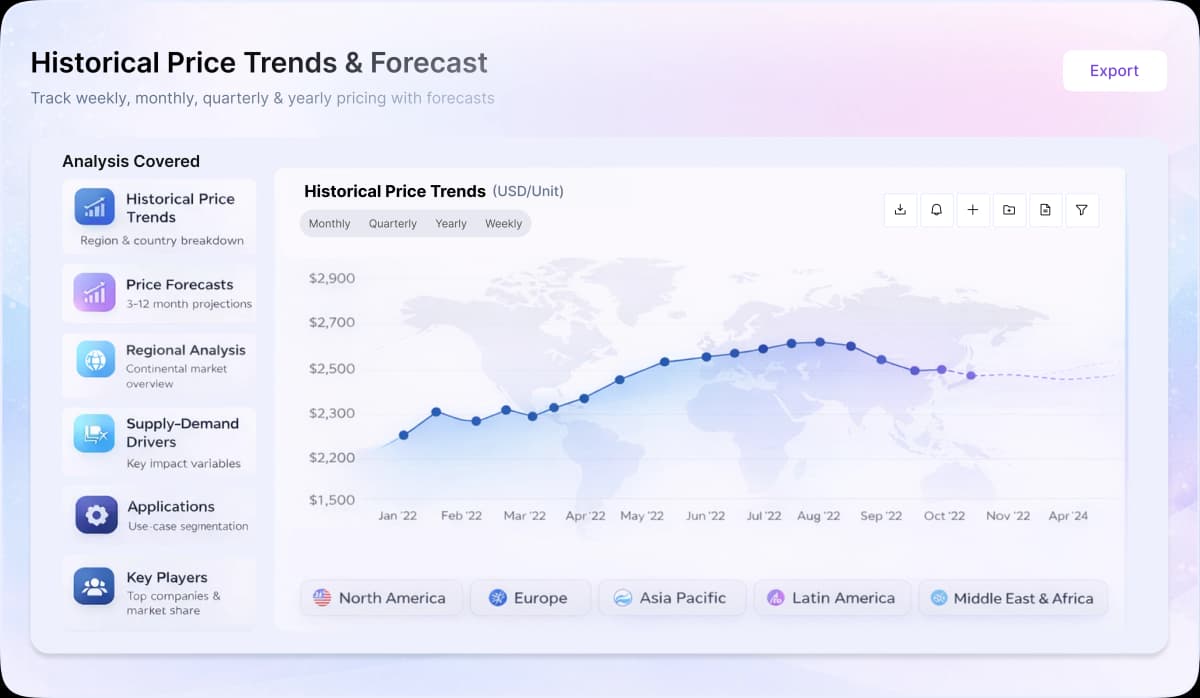
Turn price intelligence into action with the Procurement Resource Database. Log in or subscribe to unlock live price trends, historical charts, supplier databases, cost curves, and analyst-backed insights across chemicals, agriculture, energy, packaging, and more. Use these tools to benchmark your contracts, plan budgets with confidence, and stay ahead of market moves on every product you buy.

0

+

Products

0

+

Regions

0

+

Subscriptions

Asia

In Asia, Niacin prices in 2024 moved through a mostly firm trend. Early in the year, demand from nutrition and supplement manufacturers stayed steady, while some producers dealt with short pauses in operations due to holidays. This created brief tightness in supply and supported higher price levels. As the year progressed, supply improved and inventories returned to more comfortable levels, which led to a period of stability. However, strong export activity and consistent domestic buying prevented any major decline. In the second half of the year, increased manufacturing activity and early stocking before major holidays added fresh upward pressure. By year end, the combination of strong demand and logistical caution kept the market firm.

Europe

In Europe, Niacin prices in 2024 generally moved upward. Early in the year, high operating costs and steady purchases from food and health-related sectors supported the market. In the middle of the year, global supply concerns and tighter availability encouraged buyers to restock earlier, which strengthened the upward movement. Toward the final quarter, higher import costs and transport challenges added pressure on prices. Many buyers increased inventories to avoid disruptions, keeping the market firm until the close of the year.

North America

In North America, Niacin prices in 2024 followed a steady rising pattern. During the first half, companies increased procurement as a precaution against potential supply delays. Logistics issues and higher production costs added support to the upward movement. In the second half, buyers continued to build stocks ahead of expected early 2025 uncertainties. While supply was generally adequate, cautious inventory strategies and rising expenses kept prices firm throughout the year.


About Niacin

Niacin or Nicotinic acid is basically known as a water-soluble vitamin whose derivatives such as NADH, NAD, NAD+, and NADP play crucial roles in energy metabolism in the living cell as well as in DNA repair. Niacin can be easily found in a variety of whole and processed foods, with highest contents in fortified packaged foods, meat, poultry, red fish like tuna and salmon, lesser amounts in nuts, legumes, and seeds.


Niacin Product Detail

HS Code
29362920
Chemical Formula

C6H5NO2 or C5H4NCOOH

CAS Number
59-67-6
Molecular Weight
123.11 g/mol
Industrial Uses

Intermediates, Processing Aid in Food, Processing Aid in Animal Feed

Synonyms

Pyridine-3-carboxylic Acid, Nicotinic Acid , 3-Carboxypyridine

Supplier Database

Acros Organics, Charkit Chemical Company LLC, Penta Manufacturing Company

Regional Coverage

Asia Pacific

China, India, Indonesia, Pakistan, Bangladesh, Japan, Philippines, Vietnam, Iran, Thailand, South Korea, Iraq, Saudi Arabia, Malaysia, Nepal, Taiwan, Sri Lanka, UAE, Israel, Hongkong, Singapore, Oman, Kuwait, Qatar, Australia, and New Zealand

Europe

Germany, France, United Kingdom, Italy,Spain, Russia, Turkey, Netherlands, Poland, Sweden, Belgium, Austria, Ireland Switzerland, Norway, Denmark, Romania, Finland, Czech Republic, Portugal and Greece

North America

United States and Canada

Latin America

Brazil, Mexico, Argentina, Columbia, Chile, Ecuador, and Peru

Africa

South Africa, Nigeria, Egypt, Algeria, Morocco

CurrencyUS$ (Data can also be provided in local currency)

Supplier Database AvailabilityYes

Customization ScopeThe report can be customized as per the requirements of the customer

Post-Sale Analyst Support360-degree analyst support after report delivery

Note: Our supplier search experts can assist your procurement teams in compiling and validating a list of suppliers indicating they have products, services, and capabilities that meet your company's needs.

Niacin Production Process

  • Production of Niacin via Oxidation of 5-Ethyl-2-Methylpyridine

In this process, 5-ethyl-2-methylpyridine is oxidised in an aqueous solution to nicotinic acid in a single-tube reactor by utilising an excess of nitric acid. The continuous process takes place somewhere around 230-270 °C.

Frequently Asked Questions

The niacin current outlook remains firm, supported by consistent demand from supplements, fortified foods, and healthcare applications. Supply tightness from raw material cost pressures and logistics constraints underpins pricing across Asia, Europe, and North America. The market's direction will hinge on whether freight and logistics continue easing, how feedstock costs evolve, whether new trade measures and tariffs take effect, and if production capacity can expand to meet steady downstream consumption.
Niacin prices are shaped by several interconnected drivers. Rising raw material costs push production expenses higher, lifting price levels across key regions. Factory-level production constraints tighten available supply, amplifying upward pressure. Freight and shipping limitations in Asia prompt buyers to secure supplies earlier, reinforcing firm pricing. In North America, winter transportation delays and new trade measures and potential tariff changes add urgency.
Niacin production is concentrated in Asia, where factory output and raw material costs drive global supply dynamics, with producers including Jubilant Ingrevia in India and Brother Enterprises in China. Lonza in Switzerland and Vertellus in the United States are also established producers. European and North American healthcare and food sectors provide consistent demand for supplements and fortified foods. Supply security hinges on Asian production stability, as freight and logistics conditions determine how efficiently supplies reach importing markets.
Niacin, also known as vitamin B3 or nicotinic acid, is produced from the key feedstock 5-ethyl-2-methylpyridine, which reacts with nitric acid in a liquid-phase oxidation step carried out at approximately 230-270 °C inside a single-tube reactor. This is followed by decarboxylation and crystallization to yield the finished niacin product, a white odorless crystalline powder with a molecular weight of about 123.1 g/mol and a density of roughly 1.47 g/cm³. The primary downstream applications driving demand are nutritional supplements, medications, energy drinks, fortified foods, and animal feed processing aids.
Niacin demand is driven primarily by the healthcare and food industries. In healthcare, it is used in medications and nutritional supplements that support brain function, cholesterol management, arthritis relief, and skin, digestive, and nervous system health. In the food sector, it is added to nutritional powders, drinks, and fortified foods as a nutrient supplement and antioxidant. Consistent consumption from supplements and fortified foods keeps prices firm across key regions, while production costs, logistics, and supply availability further shape procurement decisions globally.
China and India's concentration of niacin manufacturing within Asia means regional supply conditions directly shape global availability and pricing. Factory constraints and rising raw material costs in Asia tighten supply, while freight limitations force buyers to secure volumes earlier, compressing lead times and supporting firmer prices. This concentration limits alternative sourcing options for global buyers, strengthening supplier negotiating position. Any production disruption or policy shift in these key origins would quickly tighten global availability and push prices higher as buyers compete for constrained supply.
Procurement Resource assesses niacin prices through a structured, data-driven methodology combining primary engagement with producers, suppliers and traders, secondary market data, monitoring of feedstock and input costs, trade flow and inventory tracking, and exchange or spot benchmarks. These inputs are validated and translated into a transparent price assessment and outlook. The detailed methodology is available on the Procurement Resource website.

Our Price Analysis Methodology

About the Author

Vishakha Agrawal profile photo

Vishakha Agrawal

Lead - Social & Development Research

Delivering procurement intelligence and supply chain analytics across healthcare, FMCG, and chemicals sectors, with expertise in cost modeling, vendor mapping, and spend optimization to support data-driven sourcing decisions and procurement outcomes.

Schedule Demo

Schedule A Demo

Experience how Procurement Resource transforms raw material price data into clear, decision ready intelligence. Optimise your performance with reliable, expert market data and analysis. Schedule your demo today to experience a live walk-through where our experts will showcase interactive price charts, forecasted prices, and insights driving the prices for your key commodities, tailored to your workflows. Contact us now!

Our Team will be happy to assist you

We are just a text away

+1

Still Need Help?

Europe & Africa

+44 7573 171117

[email protected]

USA & Canada

+1 307 363 1045

[email protected]

APAC

+91 8850629517

[email protected]

Other Related Reports

Vitamin B2 Production from Glucose

This study presents the production of vitamin B2 from glucose using the process of fermentation.

Aniseed Oil Production from Steam distillation

This report provides the cost structure of aniseed oil production by steam distillation method. In this process, steam is passed over the dried fruit of aniseed which vapourised the oil into the steam.

Unlock full access to Procurement Resource's price databases, interactive charts, and short-term forecasts for thousands of commodities. Elevate your sourcing decisions by comparing prices across regions, downloading historical data, and layering in analyst-backed insights, all with our flexible plans that scale as your portfolio grows.

Still have any Questions

Contact Us
Mastercard
Wire
VISA
Stripe

Related News

View All

Why Procurement Database

Commodity Market Intelligence

Commodity Market Intelligence

Track prices, market movements, supply-demand dynamics, and industry developments across hundreds of commodities through a centralized intelligence platform built for informed procurement decisions.

Price Forecasts & Market Outlooks

Price Forecasts & Market Outlooks

Understand market fluctuations using analyst-backed forecasts, historical pricing patterns, and evolving industry trends to strengthen sourcing strategies and budget planning.

Cost & Procurement Optimization

Cost & Procurement Optimization

Leverage cost models, pricing benchmarks, and procurement insights to evaluate purchasing opportunities, improve negotiations, and enhance operational efficiency.

Global & Regional Market Insights

Global & Regional Market Insights

Access region-specific price trends, trade activities, capacity changes, and supply chain developments influencing commodity markets worldwide.

1/4