Production Operator Price Trend Analysis 2026: Latest News, Historical Prices, Supply Demand Analysis, Price Drivers & Market Insights

Written ByVikas Jha

Procurement Resource Database

Laptop screen

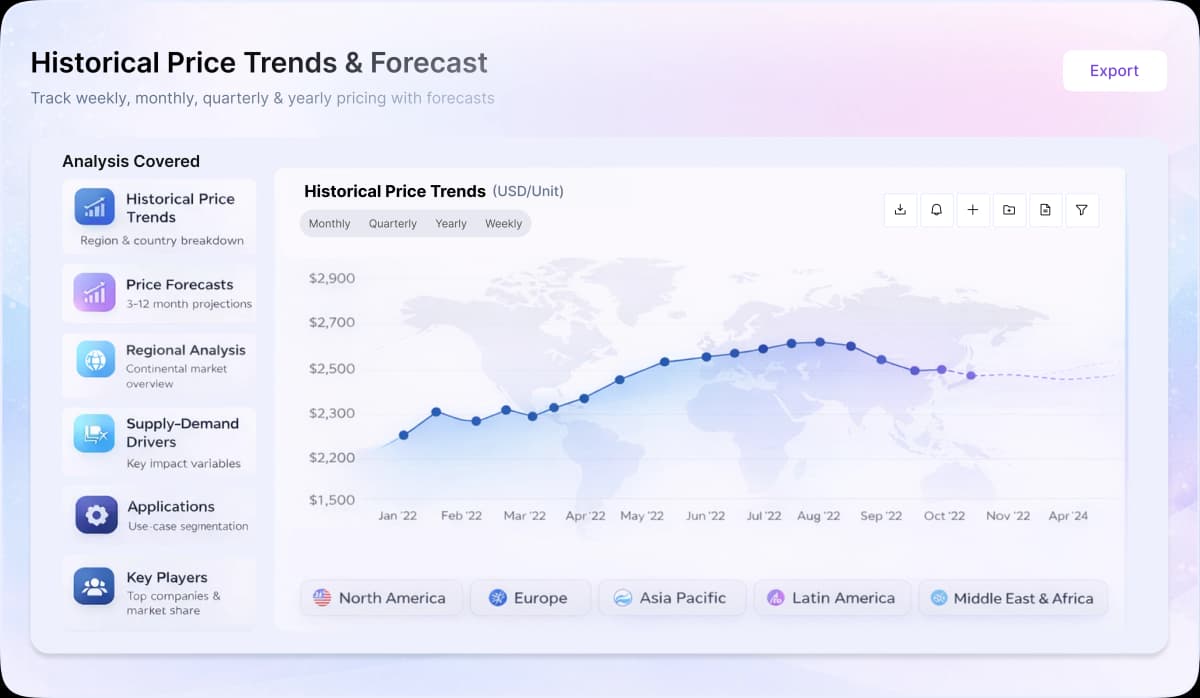
Turn price intelligence into action with the Procurement Resource Database. Log in or subscribe to unlock live price trends, historical charts, supplier databases, cost curves, and analyst-backed insights across chemicals, agriculture, energy, packaging, and more. Use these tools to benchmark your contracts, plan budgets with confidence, and stay ahead of market moves on every product you buy.

0

+

Products

0

+

Regions

0

+

Subscriptions

Production operator wages remained relatively firm during 2025 as manufacturing employers continued to face the dual challenge of maintaining adequate staffing and controlling operating costs. US production occupations continued to represent a large employment pool, with manufacturers requiring workers across assembly, fabrication, machinery operation and other shop-floor functions. Wage growth remained positive even as the broader labour market moved toward a more balanced footing, with real earnings also showing modest improvement during the year. At the same time, manufacturers increasingly invested in automation and productivity-enhancing technologies to reduce dependence on manual production processes and address persistent skills gaps. However, automation did not immediately eliminate demand for production personnel, particularly for roles requiring equipment operation, quality control and technical intervention. Consequently, production operator labour costs continued to show a firm but more moderate upward trend through 2025, supported by retention requirements and the growing technical content of modern manufacturing jobs.


About Production Operator

A production operator, or better known as a machine operator, is a person who uses equipments to assist with manufacturing, packaging, as well as other steps along a production line. Production operators attend to machines, ranging from calibrating equipment to monitoring gauges, so that everything operate correctly and smoothly, further producing the desired results.

Also, they set up cleaning and maintenance schedules for machineries to prevent any problem and keeping them in good working order. While the exact duties may vary from company to company, a production operator is typically expected to handle heavy machinery such as forklifts.

Regional Coverage

Asia Pacific

China, India, Indonesia, Pakistan, Bangladesh, Japan, Philippines, Vietnam, Iran, Thailand, South Korea, Iraq, Saudi Arabia, Malaysia, Nepal, Taiwan, Sri Lanka, UAE, Israel, Hongkong, Singapore, Oman, Kuwait, Qatar, Australia, and New Zealand

Europe

Germany, France, United Kingdom, Italy,Spain, Russia, Turkey, Netherlands, Poland, Sweden, Belgium, Austria, Ireland Switzerland, Norway, Denmark, Romania, Finland, Czech Republic, Portugal and Greece

North America

United States and Canada

Latin America

Brazil, Mexico, Argentina, Columbia, Chile, Ecuador, and Peru

Africa

South Africa, Nigeria, Egypt, Algeria, Morocco

CurrencyUS$ (Data can also be provided in local currency)

Supplier Database AvailabilityYes

Customization ScopeThe report can be customized as per the requirements of the customer

Post-Sale Analyst Support360-degree analyst support after report delivery

Note: Our supplier search experts can assist your procurement teams in compiling and validating a list of suppliers indicating they have products, services, and capabilities that meet your company's needs.

Frequently Asked Questions

The production operator outlook for 2026 points to a continued moderation in cost growth, building on the recent cooling wage trajectory and freight normalization. Labor costs remain the dominant driver, but the pace of increase is expected to stay subdued as living-cost normalization persists and supply chain efficiencies from updated trade routes and China's full market reopening continue to ease pressure. Upside risks would emerge if wage growth reaccelerates or freight costs spike, while further normalization in either factor would reinforce the softer cost environment.

Production operator costs are driven primarily by labor wages, which rise steadily but cool as living costs normalize and governments introduce relief packages. Trade rerouting and updated supply chains following geopolitical conflict, together with the reopening of major manufacturing economies such as China, ease manufacturing bottlenecks. Normalizing freight costs substantially reduce goods prices, tempering overall production cost growth.

Production operator costs are benchmarked through prevailing labor wage assessments, reflecting direct operator wages, freight normalization, and supply chain logistics. Labor wages, the dominant input, rise at a pace that decelerates as living-cost normalization takes hold. Freight cost normalization and the reopening of major manufacturing supply chains also shape the cost structure, while government relief packages provide partial offset. Together these inputs push production operator costs higher, but at a slower rate than prior years.

Production operator costs are driven primarily by labor wages as the dominant cost component. The pace of increase moderates as normalization in living costs eases wage pressure. Concurrently, freight cost normalization, following a conflict-driven spike, substantially reduces goods prices, while the reopening of major manufacturing economies eases manufacturing and supply chain constraints, collectively tempering overall production cost growth.

Regional differences in production operator rates are shaped by freight cost normalization, local labor market conditions, and supply chain restructuring. Regions with higher exposure to energy and logistics costs see steeper operator wage pass-throughs, while areas benefiting from reopened manufacturing supply chains and government relief packages experience slower cost growth. The cooling wage trajectory reflects normalization in living costs across most markets, though the pace of deceleration varies by region based on local demand balance and regulatory environments.

Crude oil prices affect production operator costs primarily through general energy costs and freight normalization. Production operator costs rise at a decelerating pace as freight costs normalize after a conflict-driven spike that had moved alongside crude. The pass-through is lagged: elevated crude lifts fuel, bunker, and logistics costs, which feed into overall production expenses before eventually easing as energy markets stabilize.

Procurement Resource assesses production operator prices through a structured, data driven methodology that combines primary engagement with producers, suppliers and traders, secondary market data, continuous monitoring of feedstock and input costs, trade-flow and inventory tracking, and exchange or spot benchmarks. Each data point is validated and translated into a transparent price assessment and outlook. The detailed methodology is available on the Procurement Resource website.

Our Price Analysis Methodology

About the Author

Vikas Jha profile photo

Vikas Jha

Vice President - Sales and Operations

Driving growth and operational excellence at Procurement Resource by partnering with global enterprises on procurement consulting and client solutions, with expertise in scaling research operations and delivering actionable commodity intelligence.

Schedule Demo

Schedule A Demo

Experience how Procurement Resource transforms raw material price data into clear, decision ready intelligence. Optimise your performance with reliable, expert market data and analysis. Schedule your demo today to experience a live walk-through where our experts will showcase interactive price charts, forecasted prices, and insights driving the prices for your key commodities, tailored to your workflows. Contact us now!

Our Team will be happy to assist you

We are just a text away

+1

Still Need Help?

Europe & Africa

+44 7573 171117

[email protected]

USA & Canada

+1 254 254 1750

[email protected]

APAC

+91 8850629517

[email protected]

Other Related Reports

Dried Meat Powder Production from Spray Drying

This report shows the cost structure of dried meat powder production by spray drying. Lean meat is first grounded in a regular meat grinding machine or sausage device.

Sodium Alginate Production from Alginic Acid Method

This report provides the cost structure of sodium alginate production from alginic acid. In this process, wet seaweed is chopped and treated with dilute formalin to form sodium alginate solution.

Unlock full access to Procurement Resource's price databases, interactive charts, and short-term forecasts for thousands of commodities. Elevate your sourcing decisions by comparing prices across regions, downloading historical data, and layering in analyst-backed insights, all with our flexible plans that scale as your portfolio grows.

Still have any Questions

Contact Us
Mastercard
Wire
VISA
Stripe

Related News

View All

Why Procurement Database

Commodity Market Intelligence

Commodity Market Intelligence

Track prices, market movements, supply-demand dynamics, and industry developments across hundreds of commodities through a centralized intelligence platform built for informed procurement decisions.

Price Forecasts & Market Outlooks

Price Forecasts & Market Outlooks

Understand market fluctuations using analyst-backed forecasts, historical pricing patterns, and evolving industry trends to strengthen sourcing strategies and budget planning.

Cost & Procurement Optimization

Cost & Procurement Optimization

Leverage cost models, pricing benchmarks, and procurement insights to evaluate purchasing opportunities, improve negotiations, and enhance operational efficiency.

Global & Regional Market Insights

Global & Regional Market Insights

Access region-specific price trends, trade activities, capacity changes, and supply chain developments influencing commodity markets worldwide.

1/4