LME Tin Rises Overnight
LME tin posted a gain overnight, bucking the broader trend in overseas base metals which mostly declined. The move adds to recent volatility in tin markets heading into the National Day holiday period in China.

LME tin posted a gain overnight, bucking the broader trend in overseas base metals which mostly declined. The move adds to recent volatility in tin markets heading into the National Day holiday period in China.
SHFE tin posted gains amid broad-based metals strength, while LME tin edged lower in mixed overseas trading. A weaker US dollar provided tailwind across base metals, supporting upward price momentum for tin on the domestic futures market.
| Product | Region | Incoterm Basis | Price | Last Updated Month |
|---|---|---|---|---|
| Tin | China | FOB | USD 63,194.80/MT | August 2026 |
| Tin | India | CIF | USD 63,285.59/MT | August 2026 |
| Tin | USA | CIF | USD 63,350.42/MT | August 2026 |
| Tin | Germany | CIF | USD 63,308.39/MT | August 2026 |
| Tin | Australia | CIF | USD 63,289.47/MT | August 2026 |
| Tin | China | FOB | USD 60,671.71/MT | July 2026 |
| Tin | India | CIF | USD 60,778.52/MT | July 2026 |
| Tin | USA | CIF | USD 60,859.20/MT | July 2026 |
| Tin | Germany | CIF | USD 60,805.34/MT | July 2026 |
| Tin | Australia | CIF | USD 60,770.17/MT | July 2026 |
Stay updated with the latest Tin prices, historical data, and tailored regional analysis
Asia
Tin prices in China increased to ~USD 55,460.58/MT in April and ~USD 60,806.00/MT in June, showing a ~9.6% increase. The market strengthened due to limited refined metal availability, slower recovery of Myanmar mine supply and restricted concentrate flows. Indonesian refined tin exports improved during May but remained significantly below the previous year, keeping global availability tight. Additional supply from Peru provided limited relief as refined output constraints remained the major issue. Demand was supported by electronics manufacturing, with computer and communication equipment output increasing 17.0% year over year and integrated-circuit production rising 22.9% in May. Electric vehicle production also supported tin consumption through electronic components and solder applications. However, weaker demand from conventional electronics, tinplate and consumer appliances contributed to the late-quarter correction as concentrate arrivals improved and traders reduced inventories.
Europe
Tin prices in Germany were ~USD 55,586.58/MT in April and ~USD 60,928.00/MT in the last month of Q2’26, showing a ~9.6% increase. European markets followed global movements, with prices supported early in Q2 by supply concerns and later easing as availability improved. Regional refined tin production had increased, while consumption remained weaker compared with previous periods, reducing immediate shortage risks. Semiconductor demand provided support, with European semiconductor sales increasing 54.7% year over year in April. However, weak industrial activity, lower durable goods production and cautious inventory management limited broader demand growth from appliances and general manufacturing.
North America
Tin prices in the United States increased from ~USD 55,547.58/MT to ~USD 60,961.00/MT during the quarter, showing a ~9.7% increase. The market benefited from strong technology-sector demand and tighter imported supply conditions. Semiconductor sales in the Americas increased 115.8% year over year in April, supporting solder demand for servers, communication equipment and electronic assemblies. Information-processing equipment output also improved, supporting high-value tin consumption. However, weaker demand from automotive and traditional consumer applications limited broader market strength, leading to some easing later in the quarter as supply availability improved.
Analyst Insight
According to Procurement Resource, tin prices are expected to remain sensitive to mine supply recovery, concentrate availability and semiconductor demand, with supply risks continuing to support the market.
Related Report
Need Latest Tin Prices?
Get real-time price assessments, periodic trends, forecasts and price driver insights across key global markets.
Our Clients






























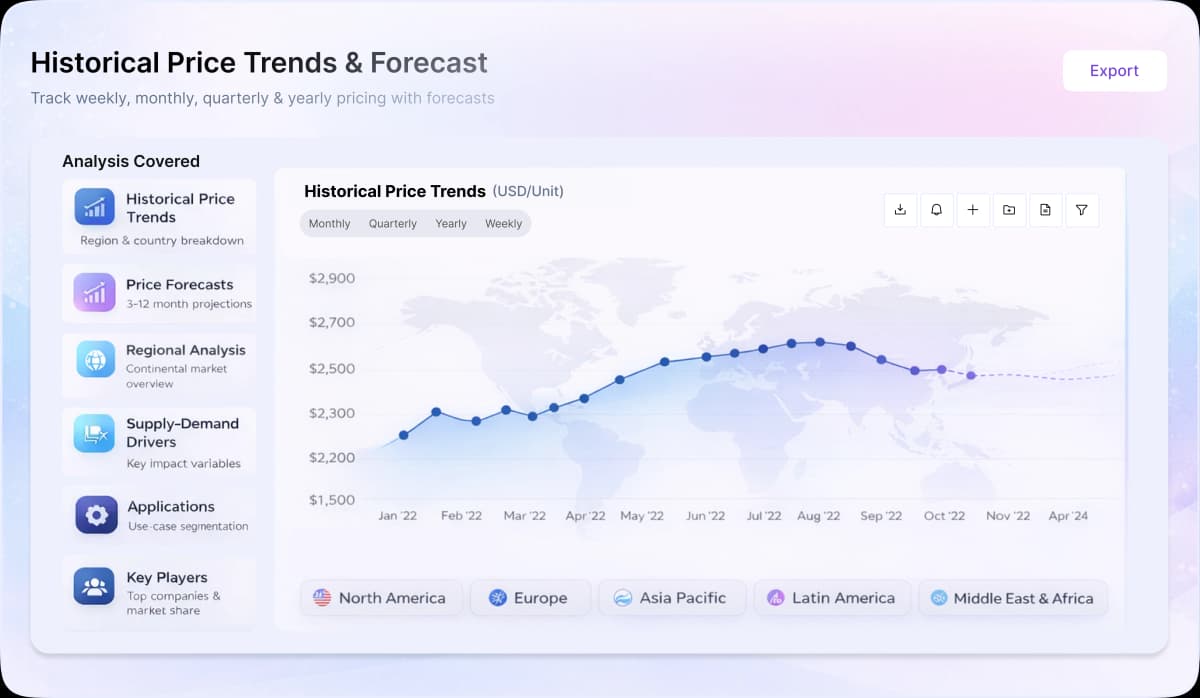
Turn price intelligence into action with the Procurement Resource Database. Log in or subscribe to unlock live price trends, historical charts, supplier databases, cost curves, and analyst-backed insights across chemicals, agriculture, energy, packaging, and more. Use these tools to benchmark your contracts, plan budgets with confidence, and stay ahead of market moves on every product you buy.
0
+Products
0
+Regions
0
+Subscriptions
Asia
In Asia, the tin market dynamics remained mixed during Q1’26. China, the largest global producer, played a central role in supply, with global tin mine production estimated at ~294,000 metric tons. Tight ore availability due to disruptions in Myanmar and export restrictions from Indonesia constrained raw material supply, supporting prices in the early part of the quarter. Strong demand from semiconductor packaging and electronics applications, particularly linked to advanced computing technologies, sustained the consumption of tin-based solder. However, elevated upstream prices reduced downstream purchasing appetite, leading to cautious procurement and limiting further price gains.
Europe
In Europe, tin prices showed a declining trend over the quarter. The prices were ~46.19 EUR/kg (spot FD) in January and ~44.13 EUR/kg in March, reflecting a decline of ~4.45%. The downturn was driven by moderate downstream demand and cautious buying behaviour, which limited price support despite constrained availability of tin. Trade protection measures, including anti-dumping duties on imported tin mill products, influenced regional supply flows, while dependence on imports and tight raw material availability maintained underlying pressure on the market.
North America
In North America, tin prices weakened during the quarter, influenced by broader non-ferrous metal market conditions. Strong currency movements and macroeconomic uncertainty reduced investor confidence and weakened market sentiment. Limited downstream purchasing activity and sufficient inventories further pressured prices, leading to a softer trend despite steady demand from industrial applications.
Tin is a silvery-white chemical element with a faint yellow hue. A post-transition metal, it is soft and malleable in nature. Tin can be obtained from the mineral cassiterite and remains solid at room temperature. The boiling point of Tin is about 2875 K (2602 °C) while its melting point is about 505.08 K (231.93 °C).
Sn
Tin plating, Specialised alloys, Optoelectronics, Soldering
7440-31-5
Umicore N.V, American Elements, Yunnan Tin Group Company Limited (YTC), PT Timah (Persero) Tbk, Malaysia Smelting Corporation Berhad, Minsur S.A, Thailand Smelting and Refining Co., Ltd. (THAISARCO)
CurrencyUS$ (Data can also be provided in local currency)
Supplier Database AvailabilityYes
Customization ScopeThe report can be customized as per the requirements of the customer
Post-Sale Analyst Support360-degree analyst support after report delivery
Note: Our supplier search experts can assist your procurement teams in compiling and validating a list of suppliers indicating they have products, services, and capabilities that meet your company's needs.
Tin is extracted by roasting mineral cassiterite with carbon at nearly 2500 degrees Fahrenheit in a furnace. After this, it is treated in an electrostatic or magnetic furnace, which helps in the removal of impurities. Finally, the separation of any heavy metal impurities leads to the formation of Tin.
Our Price Analysis Methodology

Senior Business Insights Analyst
Delivering price trend analysis and procurement market insights at Procurement Resource, with expertise in identifying commodity patterns, supporting purchasing strategies, and improving cost efficiency through actionable market intelligence.
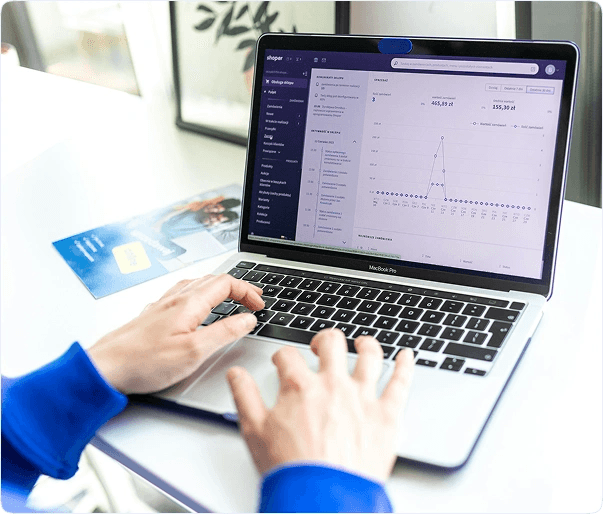
Experience how Procurement Resource transforms raw material price data into clear, decision ready intelligence. Optimise your performance with reliable, expert market data and analysis. Schedule your demo today to experience a live walk-through where our experts will showcase interactive price charts, forecasted prices, and insights driving the prices for your key commodities, tailored to your workflows. Contact us now!
Our Team will be happy to assist you
We are just a text away
Still Need Help?
This report provides the cost structure of tin can by two-piece or three-piece drawing process.
This report provides the cost structure of tinplate by strip mill process. In this process, the hot rolled steel sheets are pickled in acid to remove the iron oxide layer formed.
Tin(II) Chloride Manufacturing Plant Project Report thoroughly focuses on every detail that encompasses the cost of manufacturing. Our extensive cost model meticulously covers breaking down expenses around raw materials, labour, technology, and manufacturing expenses. This enables precise cost structure optimization and helps in identifying effective strategies to reduce the overall cash cost of manufacturing.
Unlock full access to Procurement Resource's price databases, interactive charts, and short-term forecasts for thousands of commodities. Elevate your sourcing decisions by comparing prices across regions, downloading historical data, and layering in analyst-backed insights, all with our flexible plans that scale as your portfolio grows.
Still have any Questions
Contact Us



Price Trend Dashboard - What's Included
Price trends across a diverse portfolio of categories and products, spanning board to niche chemicals
Coverage extendable to grade-specific chemicals based on procurement requirements
Regular price tracking supported by robust historical datasets
News, policy updates, and key market drivers impacting price movements
Short-term and long-term price outlooks and forecasts
Supply–demand dynamics and capacity-driven market analysis

Track prices, market movements, supply-demand dynamics, and industry developments across hundreds of commodities through a centralized intelligence platform built for informed procurement decisions.

Understand market fluctuations using analyst-backed forecasts, historical pricing patterns, and evolving industry trends to strengthen sourcing strategies and budget planning.

Leverage cost models, pricing benchmarks, and procurement insights to evaluate purchasing opportunities, improve negotiations, and enhance operational efficiency.
Access region-specific price trends, trade activities, capacity changes, and supply chain developments influencing commodity markets worldwide.