Process Water Price Trend Analysis 2026: Historical Prices, Supply Demand Analysis, Price Drivers, Latest News & Market Insights

Pragati Agarwal profile photo
Written ByPragati Agarwal

Procurement Resource Database

Laptop screen

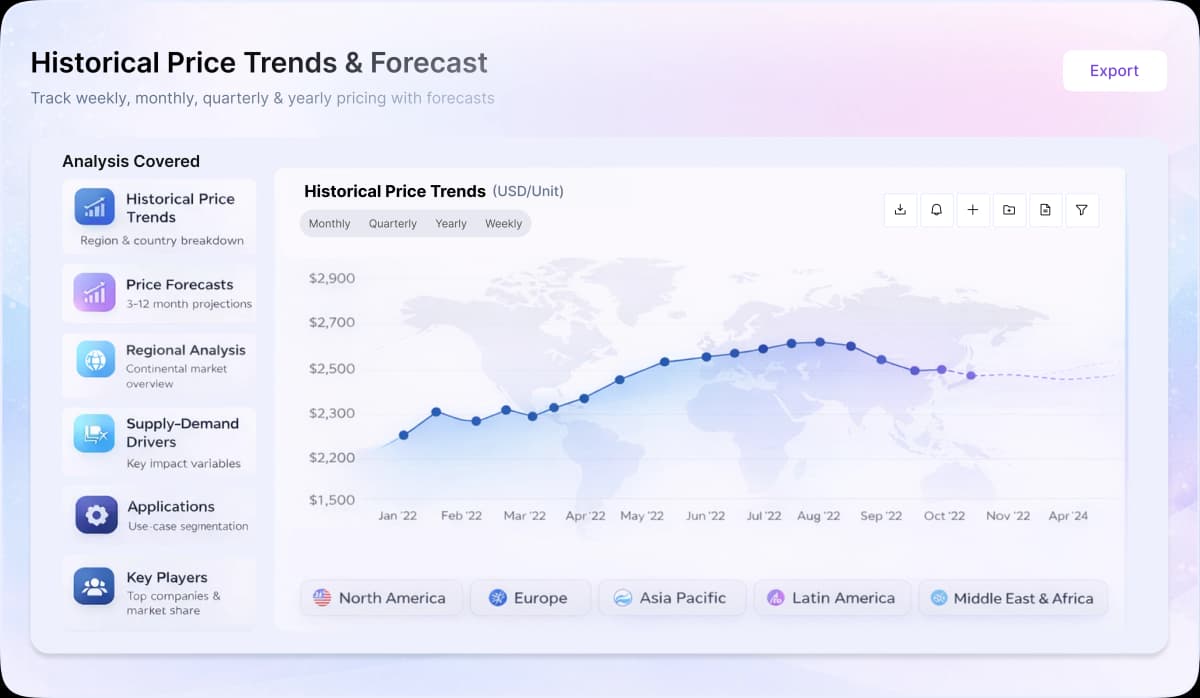
Turn price intelligence into action with the Procurement Resource Database. Log in or subscribe to unlock live price trends, historical charts, supplier databases, cost curves, and analyst-backed insights across chemicals, agriculture, energy, packaging, and more. Use these tools to benchmark your contracts, plan budgets with confidence, and stay ahead of market moves on every product you buy.

0

+

Products

0

+

Regions

0

+

Subscriptions

The process water market in the year 2025 showed a gradual rise in the prices of the product. This was because the demand for the product was rising in industries such as the chemical industry, the pharmaceutical industry, the food and beverage industry, and the manufacturing industry. These industries were expanding their capacities in order to cater to the growing demand from consumers and the market globally.

The industries were also focusing more on the sustainability of the water they were using in the processes. This was because of the environmental policies that were becoming stricter in the market, and the water shortage in the market was affecting the supply of the product.

The industrial operators were increasingly using water management technologies and automation systems to optimize water usage, avoid downtime, and deliver consistent product quality. This approach not only minimized risks but also created a new need for treated process water.

Overall, the market continued to show healthy growth with moderate pricing pressures, driven by growing industrial production and sustainability initiatives that reinforced the need for reliable process water supplies.


About Process Water

Process Water refers to water which cannot be classified as drinking water, but is used in relation to industrial plants, production facilities, and power plants. It covers the wide range of boiler feed water, cooling water for heat engine or exchangers, chemicals dilution, etc.

Process Water should typically have a conductivity between 0.1 and 50 uS/cm, with little or no hardness to prevent scaling in a heating system. As oxygen and carbon dioxide cause corrosion, they should be removed to prevent it. Further, the water quality requirements may vary based on its application.

Process Water Product Detail

Industrial Uses

Boiler make-up water, Cooling tower make-up water, Coating and plating, Rinsing and spraying, Washing, Others

Supplier Database

Lenntech B.V., Veolia Environnement SA, Suez SA, Silhorko-Eurowater A/S, BQUA Company

Regional Coverage

Asia Pacific

China, India, Indonesia, Pakistan, Bangladesh, Japan, Philippines, Vietnam, Iran, Thailand, South Korea, Iraq, Saudi Arabia, Malaysia, Nepal, Taiwan, Sri Lanka, UAE, Israel, Hongkong, Singapore, Oman, Kuwait, Qatar, Australia, and New Zealand

Europe

Germany, France, United Kingdom, Italy,Spain, Russia, Turkey, Netherlands, Poland, Sweden, Belgium, Austria, Ireland Switzerland, Norway, Denmark, Romania, Finland, Czech Republic, Portugal and Greece

North America

United States and Canada

Latin America

Brazil, Mexico, Argentina, Columbia, Chile, Ecuador, and Peru

Africa

South Africa, Nigeria, Egypt, Algeria, Morocco

CurrencyUS$ (Data can also be provided in local currency)

Supplier Database AvailabilityYes

Customization ScopeThe report can be customized as per the requirements of the customer

Post-Sale Analyst Support360-degree analyst support after report delivery

Note: Our supplier search experts can assist your procurement teams in compiling and validating a list of suppliers indicating they have products, services, and capabilities that meet your company's needs.

Frequently Asked Questions

The process water outlook for 2026 remains firm through H2, driven by industrial activity, stricter environmental standards, and advanced treatment adoption. Water stress in key industrial corridors and rising quality requirements for recycled water are sustaining treatment service costs. Prices could ease if freshwater availability improves or industrial demand softens, but capacity expansions and regulatory pressure should keep the market supported.

Process water prices are driven by capacity expansions across chemical, pharmaceutical, food and beverage, and manufacturing sectors, alongside water stress that tightens availability in Asia Pacific. In Europe, stricter environmental regulations elevate treatment costs, while North American facility expansions sustain demand pull. Growing adoption of water recycling and closed-loop systems raises quality requirements for recirculated water, sustaining elevated treatment costs. Ongoing industrial activity, stricter standards, and advanced treatment infrastructure investment keep the market supported.

Process water is priced through direct procurement contracts tied to treatment service costs, with rates reflecting the full cost of sourcing, treating, and delivering water to industrial specifications. The cost structure is dominated by treatment and service costs, which are elevated by stricter environmental regulations and rising quality requirements for recycled and closed-loop water systems. Regional availability tightness from water stress and facility expansion demand adds a location premium, while industrial activity levels in chemical, pharmaceutical, food and beverage, and manufacturing sectors set the baseline volume-driven rate.

Process water prices reflect multiple interacting cost drivers. Capacity expansions across chemical, pharmaceutical, food and beverage, and manufacturing sectors lift demand for treated water. Water stress in Asia Pacific industrial corridors tightens regional availability. In Europe, tightening environmental and water quality regulations sustain elevated treatment costs. Wider adoption of water recycling and closed-loop systems raises quality requirements for recirculated water. North American facility expansions maintain demand with a modest upward bias, while Latin American growth is moderated by logistical constraints.

The chemical, pharmaceutical, food and beverage, and manufacturing sectors face the highest process water costs, relying on consistent quality treated water. Capacity expansions drive robust demand, with Asia Pacific manufacturing volumes particularly strong. In Europe, tightening environmental and water quality regulations elevate treatment costs despite stable output, while North American facility expansions sustain demand with a modest upward price bias. Wider adoption of water recycling and closed-loop treatment systems raises quality requirements for recirculated water, sustaining elevated treatment service costs across key sectors.

Process water pricing varies across regions due to distinct supply-demand balances, regulatory burdens, and logistics realities. Asia Pacific sees robust volumes on strong manufacturing activity, with water stress in some industrial corridors tightening availability. In Europe, tightening environmental and water quality regulations sustain elevated treatment costs, pushing regional rates above Latin America, where gradual demand growth is moderated by logistical and infrastructure constraints. North America sits balanced with a modest upward bias, as facility expansions and production ramp ups maintain consistent demand pull.
Crude oil prices affect process water indirectly and with a lag, primarily through energy costs embedded in water treatment operations. Treatment processes, pumping, and transportation draw on energy whose cost follows crude-linked fuel and power prices. When crude rises, energy expenses for treatment operators increase, sustaining higher service charges even as recycling adoption moderates intake volumes. The pass-through accumulates as energy contracts reset. Firm industrial activity and stricter environmental standards keep treatment demand elevated, reinforcing an upward bias in process water costs regardless of crude-driven energy moves.



Procurement Resource assesses process water prices through a structured, data-driven methodology that combines primary engagement with producers, suppliers and traders, secondary market data, monitoring of feedstock and input costs, trade-flow and inventory tracking, and exchange or spot benchmarks. These inputs are validated and translated into a transparent price assessment and outlook. The detailed methodology is available on the Procurement Resource website.

Our Price Analysis Methodology

About the Author

Pragati Agarwal profile photo

Pragati Agarwal

Senior Business Insights Analyst

Delivering price trend analysis and procurement market insights at Procurement Resource, with expertise in identifying commodity patterns, supporting purchasing strategies, and improving cost efficiency through actionable market intelligence.

Schedule Demo

Schedule A Demo

Experience how Procurement Resource transforms raw material price data into clear, decision ready intelligence. Optimise your performance with reliable, expert market data and analysis. Schedule your demo today to experience a live walk-through where our experts will showcase interactive price charts, forecasted prices, and insights driving the prices for your key commodities, tailored to your workflows. Contact us now!

Our Team will be happy to assist you

We are just a text away

+1

Still Need Help?

Europe & Africa

+44 7573 171117

[email protected]

USA & Canada

+1 254 254 1750

[email protected]

APAC

+91 8850629517

[email protected]

Other Related Reports

Steam Production from Water

This report provides the cost structure steam production from water. The process involves adding heat energy to water at standard pressure.

Cooling Water Production from Cooling Tower

This report provides the cost structure of cooling water production through the use of cooling tower. In this process, the water is pumped into the cooling tower which flows down through wooden or plastic shells.

Stevia Production from Water Extraction Process

Dry leaves of stevia rebaudiana are immersed in hot water to extract steviol glycosides, which is the main sweetening element in stevia.

Unlock full access to Procurement Resource's price databases, interactive charts, and short-term forecasts for thousands of commodities. Elevate your sourcing decisions by comparing prices across regions, downloading historical data, and layering in analyst-backed insights, all with our flexible plans that scale as your portfolio grows.

Still have any Questions

Contact Us
Mastercard
Wire
VISA
Stripe

Related News

View All

Why Procurement Database

Commodity Market Intelligence

Commodity Market Intelligence

Track prices, market movements, supply-demand dynamics, and industry developments across hundreds of commodities through a centralized intelligence platform built for informed procurement decisions.

Price Forecasts & Market Outlooks

Price Forecasts & Market Outlooks

Understand market fluctuations using analyst-backed forecasts, historical pricing patterns, and evolving industry trends to strengthen sourcing strategies and budget planning.

Cost & Procurement Optimization

Cost & Procurement Optimization

Leverage cost models, pricing benchmarks, and procurement insights to evaluate purchasing opportunities, improve negotiations, and enhance operational efficiency.

Global & Regional Market Insights

Global & Regional Market Insights

Access region-specific price trends, trade activities, capacity changes, and supply chain developments influencing commodity markets worldwide.

1/4