Crude Futures Firm on Spot Demand
Crude oil futures firmed amid firm spot demand, with both major global benchmarks edging higher in trade. Increased positioning by market participants reflected continued underlying demand support.
Strait of Hormuz closure continues to constrain global oil supply, with observed output remaining significantly below year-ago levels. IEA revised its demand forecast downward as inventories fell to multi-decade lows, reinforcing upward price pressure and market volatility.
| Product | Region | Incoterm Basis | Price | Last Updated Month |
|---|---|---|---|---|
| Base Oil | USA | FOB | USD 1,835.00/MT | June 2026 |
| Base Oil | UAE | CFR | USD 1,937.55/MT | June 2026 |
| Base Oil | Germany | FOB | USD 2,019.93/MT | June 2026 |
| Base Oil | Singapore | FOB | USD 1,530.00/MT | June 2026 |
| Base Oil | India | CFR | USD 1,520.00/MT | June 2026 |
| Base Oil | USA | FOB | USD 1,815.00/MT | May 2026 |
| Base Oil | UAE | CFR | USD 1,720.00/MT | May 2026 |
| Base Oil | Germany | FOB | USD 1,950.00/MT | May 2026 |
| Base Oil | Singapore | FOB | USD 1,590.00/MT | May 2026 |
| Base Oil | India | CFR | USD 1,535.00/MT | May 2026 |
Stay updated with the latest Base Oil prices, historical data, and tailored regional analysis
Asia
Base Oil prices in China were affected by grade-wise supply differences during Q2’26. Group I and Group II prices increased early in the quarter due to higher crude-linked costs and supply pressure but softened later as crude values declined and domestic production remained strong. China produced close to 580,000 tonnes of paraffinic base oils in April, supporting domestic Group II availability and limiting price increases compared with imported grades. Group III prices remained firm due to restricted international supply and dependence on imported premium-grade material. Later in the quarter, lower crude prices reduced feedstock support, while weaker lubricant demand and cautious purchasing pressured the market.
Europe
Base Oil prices in Germany declined to ~EUR 1.81/kg in April and ~EUR 1.67/kg in May, showing a ~7.5% decrease. European markets experienced strong price increases early in Q2 due to reduced supply, lower refinery availability and limited Group II and Group III availability. European Group II supply declined significantly during April, creating tighter conditions for lubricant blenders. However, prices stabilised later as supply improved, crude values weakened and buyers reduced inventory levels. Group III remained the tightest segment due to limited Middle Eastern availability, keeping premium-grade prices elevated.
North America
Base Oil prices in the United States declined to ~USD 2,400.00/MT in April and ~USD 1,815.00/MT in the following month. Despite the decline shown in monthly prices, the North American market faced strong supply pressure during Q2 due to maintenance shutdowns, limited Group III availability and higher export demand. Middle Eastern supply disruptions affected premium-grade availability, while producers implemented price increases across Group I, Group II and Group III grades. However, rising lubricant production costs reduced buying activity as blenders lowered operating rates and managed inventories cautiously. Lower crude prices provided some relief later in the quarter but did not fully offset supply constraints.
Analyst Insight
According to Procurement Resource, base oil prices are expected to remain dependent on crude movements, refinery availability and Group III supply recovery, with premium grades likely to remain supported.
Related Report
Need latest Base Oil price?
Get real-time price assessments, periodic trends, forecasts and price driver insights across key global markets.

Unlock Price Insights NowOur Clients

Turn price intelligence into action with the Procurement Resource Database. Log in or subscribe to unlock live price trends, historical charts, supplier databases, cost curves, and analyst-backed insights across chemicals, agriculture, energy, packaging, and more. Use these tools to benchmark your contracts, plan budgets with confidence, and stay ahead of market moves on every product you buy.
0
+Products
0
+Regions
0
+Subscriptions
Asia
In Asia, base oil prices followed an upward trend as crude oil costs increased sharply during the quarter. The Iran conflict disrupted tanker routes through the Strait of Hormuz, increasing freight charges and insurance costs, which directly raised feedstock costs for refiners. Asian refiners faced supply constraints due to reduced crude availability and logistical delays, forcing adjustments in sourcing strategies and refinery operations. Demand from lubricants and industrial sectors remained steady, but elevated prices and supply uncertainties limited aggressive procurement, keeping the market firm but controlled.


Europe
In Europe, base oil prices rose significantly from ~0.84 EUR/kg (FD NWE) in January to ~1.21 EUR/kg in March, reflecting a ~42% increase. The rise was driven by higher crude oil prices as disrupted Gulf exports forced European buyers to compete for limited cargoes. Freight rates and insurance premiums increased due to shipping risks, raising import costs. Limited availability of crude and rerouting of LNG shipments further strained energy logistics. Buyers also secured alternative sources and long-term contracts, which tightened spot availability and supported higher base oil pricing despite moderate downstream demand.
North America
In North America, base oil prices increased from ~USD 1,782/MT (FOB Texas) in January to ~USD 1,966/MT in March, marking a ~10.33% rise. The increase was driven by higher crude oil prices, which rose from USD 64/barrel in January to USD 86/barrel in March due to geopolitical tensions and supply risks. Increased freight and insurance costs for Gulf imports added to feedstock expenses, while domestic production adjustments and reliance on strategic stockpiles helped maintain supply balance. Demand from the lubricant and industrial sectors remained stable, supporting price increases.
Base oil refers to lubrication grade oils that are derived from refining crude oil (mineral base oil) or chemical synthesis (synthetic base oil). Group II base oils contain more than 90% saturates, less than 0.3% sulphur, and have a viscosity index of 80 to 120. They are commonly produced through hydrocracking, which is a more complex process than that used for Group I base oils. Group II base oils have better antioxidation properties because all of their hydrocarbon molecules are saturated.
Rubber Manufacturing, Textiles, Blending of Engine Oils
Chevron Corporation, Exxon Mobil Corporation, Hyundai and Shell Base Oil Co., Petro-Canada Lubricant, Saudi Arabian Oil Co.
CurrencyUS$ (Data can also be provided in local currency)
Supplier Database AvailabilityYes
Customization ScopeThe report can be customized as per the requirements of the customer
Post-Sale Analyst Support360-degree analyst support after report delivery
Note: Our supplier search experts can assist your procurement teams in compiling and validating a list of suppliers indicating they have products, services, and capabilities that meet your company's needs.
In this process, vacuum gas oil is used as a feedstock which is run through a hydrocracker at very high pressures. Inside the hydrocarbon, the molecules are reshaped and saturated. Sulfur is converted into hydrogen sulfide gas and nitrogen into ammonia, forming a waxy base oil containing more than 90% saturated compounds.
The second reactor is a catalytic dewaxer which converts the wax molecules to isoparaffins and causes even more saturation. Finally, the final few percent of residual aromatic compounds are saturated to form Group II base oils in a lower temperature but very high-pressure finishing step.
Our Price Analysis Methodology

Senior Business Insights Analyst
Delivering price trend analysis and procurement market insights at Procurement Resource, with expertise in identifying commodity patterns, supporting purchasing strategies, and improving cost efficiency through actionable market intelligence.

Experience how Procurement Resource transforms raw material price data into clear, decision ready intelligence. Optimise your performance with reliable, expert market data and analysis. Schedule your demo today to experience a live walk-through where our experts will showcase interactive price charts, forecasted prices, and insights driving the prices for your key commodities, tailored to your workflows. Contact us now!
Our Team will be happy to assist you
We are just a text away
Still Need Help?
This report provides the cost structure of LPG production by the petroleum refining process. In this process, the crude oil recovered is separated into oil and wet gas via a gas trap.
Petroleum Jelly Manufacturing Plant Project Report thoroughly focuses on every detail that encompasses the cost of manufacturing. Our extensive cost model meticulously covers breaking down expenses around raw materials, labour, technology, and manufacturing expenses. This enables precise cost structure optimization and helps in identifying effective strategies to reduce the overall cash cost of manufacturing.
Unlock full access to Procurement Resource's price databases, interactive charts, and short-term forecasts for thousands of commodities. Elevate your sourcing decisions by comparing prices across regions, downloading historical data, and layering in analyst-backed insights, all with our flexible plans that scale as your portfolio grows.
Still have any Questions
Contact Us


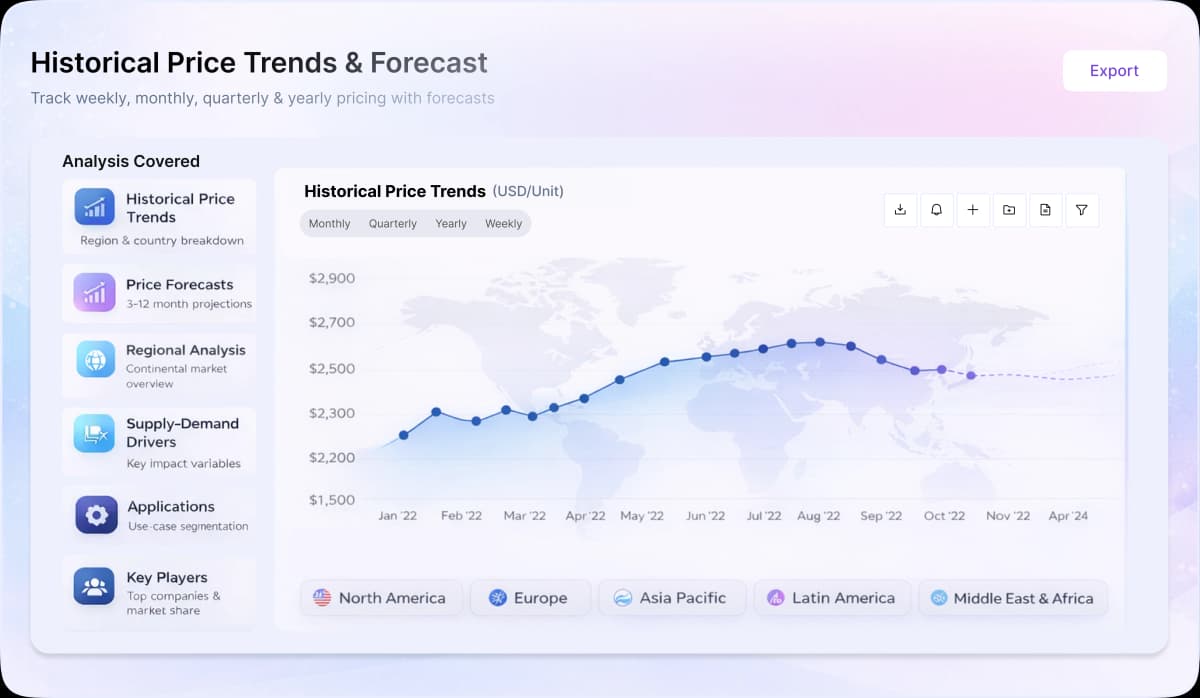
Price Trend Dashboard - What's Included
Price trends across a diverse portfolio of categories and products, spanning board to niche chemicals
Coverage extendable to grade-specific chemicals based on procurement requirements
Regular price tracking supported by robust historical datasets
News, policy updates, and key market drivers impacting price movements
Short-term and long-term price outlooks and forecasts
Supply-demand dynamics and capacity-driven market analysis