Product
Electricity Price Trend and Forecast
Electricity Price Trend and Forecast
Electricity Regional Price Overview
Get the latest insights on price movement and trend analysis of Electricity in different regions across the world (Asia, Europe, North America, Latin America, and the Middle East & Africa).
Electricity Price Trend for the First Half of 2025
During the first half of 2025, electricity prices showed mixed but generally stable trends across major global markets. In the EU, prices stayed lower compared to the same period in 2024, supported by strong growth in renewable energy generation. A mild winter and high hydropower availability also helped to ease pressure on wholesale prices.
Electricity Price Chart
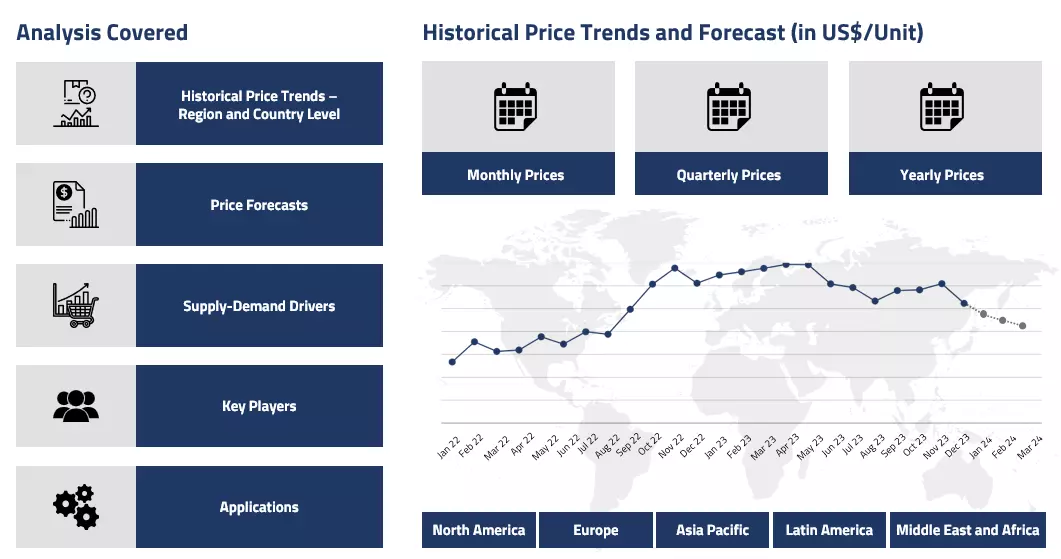
Please Login or Subscribe to Access the Electricity Price Chart Data
Solar power hit new records in spring, further reducing reliance on gas-fired generation. Combined with steady nuclear output and lower overall electricity demand, these factors kept both wholesale and retail prices in check. The declining cost of gas in early 2024 also continued to influence electricity prices positively into 2025.
In contrast, the U.S. experienced a steady increase in electricity prices through H1’25. Retail prices continued to rise faster than inflation, driven by increased infrastructure investment and the ongoing need to upgrade aging systems. Areas with already high electricity costs saw the largest price hikes. While fuel costs like natural gas had moderated, retail prices didn’t fall in step due to delayed pass-through effects and other fixed charges.
In Vietnam, a new retail electricity pricing framework was introduced, bringing more transparency to consumers. The government set clearer pricing limits, aligning with market costs while excluding VAT, suggesting a move towards more stable and predictable pricing.
Analyst Insight
According to Procurement Resource, Electricity prices in EU prices may stay moderate if renewables continue expanding, while the U.S. may see continued price pressure due to investment-driven cost increases.
Electricity Price Trend for the Second Half of 2024
Asia
In Asia, prices remained relatively stable but elevated compared to historical averages. China experienced moderate price increases due to higher industrial demand and ongoing coal supply constraints. Japan and South Korea saw price spikes during extreme weather events, particularly during the summer months. Southeast Asian markets struggled with grid reliability issues, leading to occasional price volatility, though government interventions helped maintain overall stability.
Australia and New Zealand dealt with unique challenges in their electricity markets. Australia's transition away from coal-fired generation created some price pressures, particularly during periods of low renewable output. However, the increasing role of battery storage helped moderate extreme price swings. New Zealand's heavily hydro-dependent system maintained stable prices despite occasional dry spells.
Europe
Europe witnessed a significant improvement in its electricity market compared to the previous year. Prices trended lower thanks to record renewable energy generation, particularly from wind and solar installations. The region's successful diversification away from Russian gas and mild weather conditions helped keep prices in check. However, some countries still faced challenges during peak demand periods, especially those heavily dependent on gas-fired power plants.
North America
North American markets showed mixed trends. The United States experienced regional variations, with the Northeast and West Coast seeing higher prices due to infrastructure constraints and extreme weather events. Texas faced price spikes during summer heatwaves, while the Midwest benefited from stable renewable generation. Canada maintained relatively stable prices thanks to its extensive hydroelectric capacity, though some provinces saw moderate increases due to rising operational costs.
Analyst Insight
According to Procurement Resource, the global electricity market appears set for continued transformation, with renewable energy expansion likely to help moderate prices in the long term, though grid infrastructure challenges and extreme weather events remain significant risk factors.
Electricity Price Trend for the First Half of 2024
Asia
In the first half of 2024, electricity prices in India decreased by 10% year-on-year despite an unprecedented surge in demand driven by economic growth and record heat waves. According to the International Energy Agency (IEA), this price drop was supported by proactive measures including the sale of surplus electricity on power exchanges, increased fuel supply, and improved availability of generating units, which created greater liquidity in the market.
However, prices still remained 40% above the 2019 average. During this period, India experienced an 8.5% year-on-year increase in electricity demand. The growth in demand was met with increased coal-fired and gas-fired generation, while hydropower output fell due to ongoing drought conditions. Looking forward, continued robust growth in electricity demand and a shift towards increased renewable energy generation is anticipated, with coal-fired power expected to see a limited rise in 2025.
Europe
In the first half of 2024, European electricity prices exhibited a mixed trend influenced by several factors. Despite a general decline compared to the latter half of 2023, driven by historically high solar and wind energy production, prices were subject to volatility due to fluctuating gas prices, CO2 emissions, and irregular renewable energy output. Rising temperatures and increased demand contributed to price pressures, with notable spikes observed in specific markets like Germany.
For instance, a technical glitch led to a dramatic temporary surge in prices, highlighting the sensitivity of the market. While most European markets experienced some of the lowest average electricity prices since 2021. The European energy market remains highly volatile, with concerns about energy supply stability and infrastructure constraints persisting. As Europe prepares for a seasonal price increase, ongoing efforts to expand renewable energy and enhance grid stability are critical to mitigating future price fluctuations and ensuring long-term energy affordability.
North America
In the first half of 2024, electricity prices in the United States experienced a significant increase, driven by a surge in demand due to unprecedented heat waves and ongoing climate change impacts. The dramatic rise in temperatures has led to higher energy consumption as people used more cooling systems, putting additional pressure on an already strained national grid.
This situation has exacerbated energy poverty, with a growing number of households struggling to manage their utility bills amid soaring costs. The strain on the energy infrastructure, compounded by frequent extreme weather events, has led to power outages and increased operational challenges for utility providers. Despite efforts to bolster clean energy investments and improve grid reliability, the underlying issues of extreme weather and infrastructure limitations continue to drive up electricity costs.
Analyst Insight
According to Procurement Resource, electricity prices are set for a seasonal rise in most global markets. The production sources will likely vary for most countries, however, a collective tilt towards renewable sources is evident. Prices will likely remain volatile.
Electricity Price Trend for the Second Half of 2023
Asia
In the second half of 2023, electricity prices in India experienced significant upward pressure due to a surge in demand and increased trading activity. In October 2023, the Day Ahead Market (DAM) saw a substantial 68% year-on-year increase, driven by a notable 22% rise in overall electricity consumption. This spike in demand, influenced by lower-than-average rainfall and higher usage, led to an 8.3% increase in DAM volumes, reaching 4,742 million units.
Additionally, the Green Day-Ahead Market (G-DAM) and Green Term-Ahead Market (G-TAM) also saw increased volumes, underscoring a growing emphasis on renewable energy. The overall increase in power purchase costs, influenced by higher coal imports and generation expenses, continues to drive the volatility observed in electricity prices. This period marks a phase of significant adjustment in the Indian energy market as it adapts to shifting demand and supply dynamics.
Europe
In the second half of 2023, European electricity prices began stabilizing after a steep rise in the previous months. The significant increases from the previous year, driven by high natural gas costs, slowed down. While prices remained elevated compared to 2022, the growth rate moderated. Average household electricity prices in the EU saw a moderate increase of about 14% compared to the same period in 2022.
Governments across Europe reduced the tax share on electricity bills, helping to slightly ease the financial burden on consumers. Despite this stabilization, price disparities persisted between countries, with the Netherlands experiencing the largest increase in prices while some countries, like Spain and Denmark, saw reductions. Overall, the market showed signs of adjustment and stability after the previous volatility.
North America
In the latter half of 2023, electricity prices in the USA saw notable fluctuations due to a combination of extreme weather and increased demand. The intense summer heat, with July being the hottest month on record, drove a significant rise in cooling costs, pushing average home energy expenses up by nearly 12% compared to the previous year. This surge was not primarily due to changes in energy prices but rather the heightened demand for air conditioning. The Southwest experienced the highest costs, while the Pacific Coast saw the lowest. Despite an easing of annual electricity inflation rates to 5.4% in June from a peak of nearly 13% in February, utility shutoffs increased by 15%, disproportionately impacting Black households. The soaring utility debt, now at $19.5 billion, reflects the broader financial strain.
Analyst Insight
According to Procurement Resource, the energy demand appears to be ever-rising. With EVs and a push towards clean energy, electricity consumption is set to touch new heights in the coming year.
Electricity Price Trend for the First Half of 2023
Asia
In the first half of 2023, electricity prices in India rose due to increasing operational costs and financial difficulties among distribution companies (DisComs). Higher power purchase costs and delayed state subsidies pressured regulators to raise tariffs. Despite efforts to keep cross-subsidies within ±20% of the Average Cost of Supply (ACoS), many tariffs exceeded this range, resulting in higher prices for some consumers. The sector faced additional challenges from rising distribution losses and ineffective revenue collection. These issues highlighted the need for better financial management and tariff adjustments to stabilize prices and ensure cost recovery. Consequently, consumers experienced fluctuating and higher electricity costs, emphasizing the urgent need for comprehensive reforms.
Europe
In the first half of 2023, European electricity prices displayed significant fluctuations. In June, prices rose sharply, with notable increases including approximately 8.7% in Italy, 39.4% in France, 8.3% in Germany, 85.5% in Spain, and 24.7% in Sweden compared to May. Despite these monthly spikes, the average electricity prices for H1 2023 were lower than those in the latter half of 2022.
This decrease was attributed to record-high solar and wind energy production, which helped moderate overall prices. However, the European energy market faced ongoing issues due to slow progress in upgrading grid infrastructure and permitting new renewable projects. These challenges highlighted the need for accelerated development in renewable energy and improved grid connectivity to manage price volatility more effectively in the future.
North America
In the first half of 2023, U.S. electricity prices increased due to ongoing inflation and high energy costs. Despite a mild winter, both electricity and natural gas prices rose. Regional price hikes varied widely: New England saw a 57% increase in electricity costs from January 2021 to January 2023, while the West South Central Division experienced a 36% rise. Although wholesale power prices dropped early in the year, this decrease did not immediately lower retail prices. Utilities faced rising costs for labor, maintenance, and infrastructure upgrades, despite falling natural gas prices. The push for renewable energy sources like wind and solar created additional challenges, requiring backup energy and facing transmission issues. As a result, electricity prices stayed high for consumers during this period.
Analyst Insight
According to Procurement Resource, with rising electricity consumptions globally, the prices are likely to remain inclined in the coming months as well.
Electricity Price Trend For Second Quarter of 2022
| Product | Category | Region | Price | Time Period |
| Electricity | Operating Costs, Logistics and Utilities | North America | 0.151 USD/kWh | April'2023 |
| Electricity | Operating Costs, Logistics and Utilities | North America | 0.160 USD /kWh | June'2023 |
Stay updated with the latest Electricity prices, historical data, and tailored regional analysis
Asia
India’s power demand surged in the upcoming summer months due to the above-average temperature rise. Owing to the steady rise in global energy prices, the price of electricity in India reached an all-time high in March 2022. Hence, the Indian Energy Exchange capped the power price at around 12 INR/kWh as abnormally high prices hamper the customer’s interest, simultaneously decreasing the buyer’s confidence in the market.
Towards the end of the said quarter, the prices were reduced to 6.49 INR/unit in June 2022 from 6.79 INR/unit because of the increased supply of inputs in the domestic market.
Europe
Europe energy prices hit a new maximum due to the continuing Russia- Ukraine geopolitical stance. With almost every EU member dependent on the valuable black sea cargoes to meet its energy requirement, the prices exploded in the domestic market in the wake of sanctions against Russia.
The German baseload power price averaged 325 EURO/MWh in the said quarter. This situation was exacerbated by the maintenance problems at France’s nuclear power stations, driving the costs of the contracts in France to around 366 EURO/MWh.
North America
In line with the global outlook, the price trend of electricity surged in the domestic arena during the said quarter. Due to the mismatch of supply-demand market dynamics, electricity prices went from 0.151 USD/kWh in April 2022 to 0.160 USD /kWh in June 2022.
Electricity Price Trend For First Quarter of 2022
Asia
In recent months, a convergence of recovering economic activity, severe weather occurrences, and a series of gas production disruptions has resulted in a considerable increase in global energy market prices. These factors have resulted in an increase in electricity prices in a number of area.
As a result of this, Singapore families' power tariffs were predicted to climb by an average of 5.6% in the January to March quarter, compared to the previous quarter. Without accounting for the Goods and Services Tax (GST), the household tariff is expected to increase from 24.11 cents to 25.44 cents/kWh in the quarter ending March 31, 2022.
Europe
Electric Ireland, Ireland's largest electricity and gas provider, has announced an increase in energy bills, with the average annual electricity bill expected to jump by about 300 EUR. Electricity costs will increase by 23.4% beginning May 1, 2022. On the average domestic electricity bill, the increase will amount to 24.80 EUR/month.
The increase from Electric Ireland comes after Bord Gáis announced hefty pricing hikes earlier in March. The company had postponed the hike as long as they could in the hopes that wholesale costs would fall back to levels seen in early 2021, but this has not happened.
North America
In January 2022, average electricity prices in the United States were 14.29 cents/kWh, approximately 0.94 cents higher than it was in January 2021, representing a 7.5% rise in price over the course of a single year.
Electricity Price Trend For Fourth Quarter of 2021
Asia
According to figures from the electricity ministry, India's power consumption increased by 4.5% in December to 110.34 billion units (BU). Consumption was 105.62 BU in December 2020, up from 101.08 BU in December 2019.
Peak electricity demand met or maximum supply achieved in a single day increased to 183.39 GW in December 2021, up from 182.78 GW in December 2020 and 170.49 GW in December 2019.
Europe
The European energy crisis had resulted in a dramatic rise in electricity prices, which had been particularly noticeable in Spain. Indeed, the wholesale price of power in the Iberian market in Q4 2021 was more than three times higher than in Q4 2018, the year in which the top electricity prices from 2010 to 2020 were recorded. On the Iberian wholesale market, the price of energy stood at €291.73/(MWh) in December 2021.
North America
The default rates for eight Pennsylvania electric distribution companies increased in December 2021. The increase was particularly noticeable for customers of PPL, which serves a large portion of central and eastern Pennsylvania, including the majority of Cumberland, Dauphin, Lancaster, and Perry counties. Winter electric bills for PPL's 1.4 million customers reflected a 26% rise in price, from 7.544 cents to 9.502 cents/kWh.
Electricity Price Trend For First, Second and Third Quarters of 2021
Asia
As India entered and exited COVID-19 lockdowns, electricity consumption soared and plummeted, well above seasonal peaks and dips. As the economy recovered swiftly, the demand increased dramatically, particularly in late July, resulting in increasing power exchange costs. In August 2021, the electricity price stood at 9.81 Rs/kWh.
Europe
Germany (0.1813 EUR/kWh) and Italy (0.1813 EUR/kWh) had the highest power rates in the first half of 2021 while Finland (EUR 0.0676 per kWh) and Denmark (0.0797 EUR/kWh) had the lowest prices. In the first semester of 2021, the EU average price per kWh was EUR 0.1283.
Over the last 13 years, the weight of taxes has risen by 19.4% points, from 13.8% in the first half of 2008 to 33.2% in the first half of 2021. As a result, the non-household total price, which includes non-recoverable taxes, increased by 32.5% in the first half of 2021, from 0.0968 EUR/kWh in 2008 to 0.1283 EUR/kWh.
North America
In 2021, average wholesale electricity prices at major trading hubs in the United States were higher than in 2020, as rising costs for power producing fuels, particularly natural gas, pushed electricity prices higher. In February 2021, price surges were caused by supply constraints caused by cold weather in the central United States. In the second half of 2021, average energy prices at the Illinois hub in the Midcontinent ISO market were $45/MWh (up 97% from the second half of 2020) and $61/MWh at the SP15 hub in the California CAISO market (a 37% increase).
Latin America
Brazil has been dealing with a significant water shortage. The country suffered the worst water inflow in 91 years between September 2020 and August 2021. The lack of rain had been chronic, particularly in the Southeast and Center-West basins, causing challenges in numerous sectors of the economy, leading to an increase in energy costs. The average electricity tariff for industry in the captive market was 684.77 BRL/MWh in August 2021.
Electricity Price Trend For the Year 2020
Asia
The overall sales price of electricity in China was 0.661, 0.646, 0.629, 0.616, and 0.585 RMB/kWh from 2016 to 2020, accordingly. The entire sales price showed a declining trend from 2016 to 2020, owing to variables such as power market reform, power supply structure modifications, and policy price reductions.
Europe
As a result of the Covid-19 outbreak, the consequent preventive measures, and the economic downturn, electricity demand in Europe reduced dramatically in 2020. High losses in demand were noted in Italy, Spain, and the United Kingdom, with drops of over 6%, substantially higher than the region's average drop of 4 to 5%. Average industrial electricity prices were 12.55 Euro cents/kWh.
North America
Because of capital expenditures, power rates rose across the country for all sectors (residential, industrial, commercial, and agricultural). However, due to a mix of variables including low natural gas prices and dropping costs of renewable energy, notably wind and solar, customers did not witness significant price hikes.
The nationwide average expected cost of electricity for commercial users in 2020 was 10.62 cents per kilowatt-hour, according to the US Energy Information Administration. This was down from 10.63 cents/kWh in 2019 and 10.67 cents/kWh in 2018.
Latin America
In Argentina, the rates in the industrial sector have been fluctuating in recent years, with a downward trend since 2017, when they reached 77.71 USD/MWh. The price for the industrial sector in 2020 (first quarter) was 52.78 USD/MWh, a 32% increase over 2017.
Procurement Resource provides latest prices of Electricity. Each price database is tied to a user-friendly graphing tool dating back to 2014, which provides a range of functionalities: configuration of price series over user defined time period; comparison of product movements across countries; customisation of price currencies and unit; extraction of price data as excel files to be used offline.
About Electricity
Electricity refers to the flow of electrical power or charge. Electricity is one of the most widely used forms of energy as well as a basic part of nature. The electricity that we use at our homes is a secondary energy source because it is generated by the conversion of primary energy sources including coal, natural gas, solar energy, hydraulic energy, and wind energy, into electrical power. Further, as electricity can also be converted into other forms of energy like mechanical energy or heat, it is also referred to as an energy carrier.
Electricity Product Details
| Report Features | Details |
| Product Name | Electricity |
| Industrial Uses | Residential Uses, Industrial Uses, Transportation, Commercial Buildings |
| Synonyms | Power, Energy |
| Supplier Database | State Grid Corporation of China (SGCC), Enel Group, General Electric Co, Korea Electric Power Corporation (KEPCO), Tokyo Electric Power Company Holdings Inc (TEPCO), EDF (Électricité de France) S.A., RWE AG |
| Region/Countries Covered | Asia Pacific: China, India, Indonesia, Pakistan, Bangladesh, Japan, Philippines, Vietnam, Iran, Thailand, South Korea, Iraq, Saudi Arabia, Malaysia, Nepal, Taiwan, Sri Lanka, UAE, Israel, Hongkong, Singapore, Oman, Kuwait, Qatar, Australia, and New Zealand Europe: Germany, France, United Kingdom, Italy, Spain, Russia, Turkey, Netherlands, Poland, Sweden, Belgium, Austria, Ireland Switzerland, Norway, Denmark, Romania, Finland, Czech Republic, Portugal and Greece North America: United States and Canada Latin America: Brazil, Mexico, Argentina, Columbia, Chile, Ecuador, and Peru Africa: South Africa, Nigeria, Egypt, Algeria, Morocco |
| Currency | US$ (Data can also be provided in local currency) |
| Supplier Database Availability | Yes |
| Customization Scope | The report can be customized as per the requirements of the customer |
| Post-Sale Analyst Support | 360-degree analyst support after report delivery |
Note: Our supplier search experts can assist your procurement teams in compiling and validating a list of suppliers indicating they have products, services, and capabilities that meet your company's needs.
Electricity Production Processes
- Production of Electricity from Mechanical Energy
In order to generate electrical energy, electric power plants use turbines that convert the potential and kinetic energy of a moving fluid to mechanical energy. A moving fluid, like water, steam, or air, pushes a series of blades mounted on a shaft in a turbine generator, thus, rotating the shaft linked to a generator. On the basis of relationship between magnetism and electricity, the generator, in turn, transforms the mechanical energy to electrical energy.
Methodology
The displayed pricing data is derived through weighted average purchase price, including contract and spot transactions at the specified locations unless otherwise stated. The information provided comes from the compilation and processing of commercial data officially reported for each nation (i.e. government agencies, external trade bodies, and industry publications).
Assistance from Experts
Procurement Resource is a one-stop solution for businesses aiming at the best industry insights and market evaluation in the arena of procurement. Our team of market leaders covers all the facets of procurement strategies with its holistic industry reports, extensive production cost and pre-feasibility insights, and price trends dynamics impacting the cost trajectories of the plethora of products encompassing various industries. With the best analysis of the market trends and comprehensive consulting in light of the best strategic footstep, Procurement Resource got all that it takes.
Client's Satisfaction
Procurement Resource has made a mark for itself in terms of its rigorous assistance to its clientele. Our experienced panel of experts leave no stone unturned in ensuring the expertise at every step of our clients' strategic procurement journey. Our prompt assistance, prudential analysis, and pragmatic tactics considering the best procurement move for industries are all that sets us apart. We at Procurement Resource value our clients, which our clients vouch for.
Assured Quality
Expertise, judiciousness, and expedience are the crucial aspects of our modus operandi at Procurement Resource. Quality is non-negotiable, and we don't compromise on that. Our best-in-class solutions, elaborative consulting substantiated by exhaustive evaluation, and fool-proof reports have led us to come this far, making us the ‘numero uno' in the domain of procurement. Be it exclusive qualitative research or assiduous quantitative research methodologies, our high quality of work is what our clients swear by.
Related News
Table Of Contents
Our Clients
Get in Touch With Us

UNITED STATES
Phone:+1 307 363 1045

INDIA
Phone: +91 8850629517

UNITED KINGDOM
Phone: +44 7537 171117
Email: sales@procurementresource.com


.webp)
