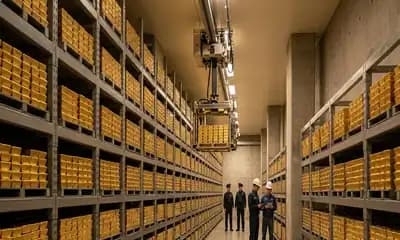
Gold Price Trends and Forecast
Get the latest insights on price movement and trends analysis of Gold in different regions across the world (Asia, Europe, North America, Latin America, and the Middle East & Africa).
For the First Half of 2022
Gold settled at 1817 USD/oz in the first half of the said year. As the Russia-Ukraine conflict developed further the investors sought high-quality liquid hedges amid rising geopolitical unpredictability, hence the price of gold climbed momentarily. But as the investors shifted attention towards the monetary policy and increased bond yields, gold lost some of its early gains.
Due to the struggle between an economy of high risk and rising interest rates, the price trends of gold stabilised by mid-May. The latter was a result of a combination of factors, including chronically high inflation and possibly positive consequences from the protracted crisis in Ukraine and its potential for global growth.
In June, gold prices continued to decline due to shifting inflation predictions and interest rate increases in important markets. In June, the SHAUPM in RMB declined by 1.3%, while the LBMA Gold Price AM in USD dropped by 2.2%.
For the First Quarter of 2022
Asia
On February 14, the spot market price of gold was 374.21 RMB/g, compared to the spot market price of 373.05 RMB/g before the Chinese New Year holidays (January 31), up 1.94 percent. The price trends of precious metals had a solid long-term convergence, and the trends was essentially the same. Stocks and bonds in the United States sank dramatically overnight as inflation statistics exceeded expectations.
For the Fourth Quarter of 2021
Asia
In Q4, the price of 24 carat gold was recorded at 45,550 INR/10g. The People's Bank of China performed a one-year MLF operation worth 500 billion yuan, with the interest rate remaining at 2.99%. MLF worth 950 billion yuan expired in December, and the central bank's RRR decrease took effect in December. The price had declined 6.63% since early 2021.
Europe
In Q4, European gold prices were at 1816 USD/MT in November and at 1782.02 USD/MT in December. The yellow metal benefitted from the regional currency's depreciation as well as the safe-haven demand.
North America
In Q4, average gold prices were at 1860 USD/oz in December. The US central bank's balance sheet had grown to USD 8.79 trillion as of December 22, 2021, up from USD 4.3 trillion in March 2020. This was a strong bull argument for gold in the medium future.
The metal’s long-term positive outlook had been shattered by the Fed's aggressive approach. However, inflation concerns and uncertainties around Omicron kept gold prices on the rise in the medium term. Inflation in the United States and changes in real bond yields were some of the catalysts for the gold surge.
Latin America
In Q4, gold prices were recorded in the range of 9250-10,200 BRL/oz. In Brazil, the market showed a higher price in November than in December, when it settled in the range of 10,000-10,200 BRL/oz. There were some restrictions due to the new variant of omicron, which halted the supply chain.
For First, Second and Third Quarters of 2021
Asia
In 2021, the Indian market revived from the COVID, with a market price of 46,150 INR/10g. Gold prices fell globally as a stronger dollar made bullion more expensive for holders of other currencies, and fears that the US Federal Reserve may tighten monetary policy sooner than expected dampened the metal's value.
Europe
In Europe, gold prices remained between 1700 USD/MT and 1800 USD/MT. While the price appreciated by 4.3% in 2021, the prices revived compared to 2020, as the US dollar's weakening increased the price of gold for the first three quarters.
North America
In 2021, for the first three quarters of the year, average gold prices were recorded at 11750 USD/oz. Inflation fears and an aggressive US Federal Reserve (Fed) posture divided investors' views on the price trends. The global spread of the Omicron strain of the coronavirus boosted gold prices. The price dropped for the first three quarters, from January to July, and then rose at the end of September.
Latin America
The Jacobina mine in Brazil, owned by Yamana Gold, was the cheapest gold mine in South America. The mine's all-in sustaining costs (AISC) of 770 USD/oz in Q1 2021 benefited by the timing of exploration spend, which was lower in the first quarter but expected to go up in the second.
Lundin Gold's Fruta del Norte mine in Ecuador is in second place, with an AISC of 830 USD/oz achieved in Q1 2021, up 9% from Q1 2020.
For the Year 2020
Asia
In June 2020, Indian price of the metal was at 48339 INR/10g. The Chinese market was slow due to the pandemic, and demand declined by 28% in May compared to the same month last year. Total supplies declined by 7% in the first quarter of 2020. On the supply and demand side, the simultaneous falling trends in its supply and consumption was difficult to reverse in a short period of time.
Global gold jewelry demand hit a new low in the first quarter of 2020. China's demand decreased by 65% year over year in the first quarter. In the second quarter, foreign demand for gold jewellery was not very strong. Despite the fact that Chinese consumption was steadily improving, worldwide consumption remained bleak.
Europe
In 2020, the average European gold prices recorded were at 1750 USD/MT. Gold prices always gain when the world economy is in trouble. The post-Brexit economic uncertainty was likely to persist for some time, helping the price rise.
Because the United Kingdom left the European Union, many investors and economists had speculated on which country would be the next to leave. There were talks that the European Union could be disbanded entirely in the next few years. Investors had flocked to gold as a result of geopolitical anxiety.
North America
In 2020, the average North American price recorded was at 1736 USD/oz. Prices rose steadily from 1517.24 USD/oz in January to 1815.15.45 in December of 2020 as a result of COVID restrictions and a global shutdown. Gold and the US dollar showed an inverse relation. In 2020, the US dollar fell to its lowest level in almost two years against a basket of other currencies. The price was on the rise due to geopolitical tensions.
Latin America
In 2020, South American prices recorded were at 1700 USD/oz. Prices soared to their highest level in ten years, as a result of global instability caused by the Coronavirus and the global economic catastrophe. That increase sparked a new, more intense gold rush in the Brazilian Amazon, with businesses investing in high-tech equipment and low-cost labor.
Procurement Resource provides latest prices of Gold. Each price database is tied to a user-friendly graphing tool dating back to 2014, which provides a range of functionalities: configuration of price series over user defined time period; comparison of product movements across countries; customisation of price currencies and unit; extraction of price data as excel files to be used offline.
Gold is most utilised in the jewelleries. In its pure form, it appears as a bright, slightly reddish yellow metal. It is soft, malleable, and ductile in its pure form. Gold, a transition metal, is one of the least reactive chemical elements, which further remains solid under standard conditions.
Report Features | Details |
Product Name | Gold |
Industrial Uses | Jewellery, Dental Filling, Electronic components, Drugs and nutrition, Cuisine |
Chemical Formula | Au |
Synonyms | 7440-57-5 |
Molecular Weight | 196.966g/mol |
Supplier Database | New Gold Inc, Barrick Gold Corporation, AngloGold Ashanti Limited , Harmony Gold Mining Company Limited, NOVAGOLD Resources Inc, Gabriel Resources Ltd. , Golden Star Resources Ltd., Freeport-McMoRan Inc. (FCX) |
Region/Countries Covered | Asia Pacific: China, India, Indonesia, Pakistan, Bangladesh, Japan, Philippines, Vietnam, Iran, Thailand, South Korea, Iraq, Saudi Arabia, Malaysia, Nepal, Taiwan, Sri Lanka, UAE, Israel, Hongkong, Singapore, Oman, Kuwait, Qatar, Australia, and New Zealand Europe: Germany, France, United Kingdom, Italy, Spain, Russia, Turkey, Netherlands, Poland, Sweden, Belgium, Austria, Ireland Switzerland, Norway, Denmark, Romania, Finland, Czech Republic, Portugal and Greece North America: United States and Canada Latin America: Brazil, Mexico, Argentina, Columbia, Chile, Ecuador, and Peru Africa: South Africa, Nigeria, Egypt, Algeria, Morocco |
Currency | US$ (Data can also be provided in local currency) |
Supplier Database Availability | Yes |
Customization Scope | The report can be customized as per the requirements of the customer |
Post-Sale Analyst Support | 360-degree analyst support after report delivery |
Note: Our supplier search experts can assist your procurement teams in compiling and validating a list of suppliers indicating they have products, services, and capabilities that meet your company's needs.
Gold is basically extracted by crushing the ores and extraction of metal (mechanical, amalgamation, or cyanidation), followed by electrolytic refining or chemical refining (use of chlorine or treatment with either hot nitric or sulphuric acid).
The displayed pricing data is derived through weighted average purchase price, including contract and spot transactions at the specified locations unless otherwise stated. The information provided comes from the compilation and processing of commercial data officially reported for each nation (i.e. government agencies, external trade bodies, and industry publications).
Procurement Resource is a one-stop solution for businesses aiming at the best industry insights and market evaluation in the arena of procurement. Our team of market leaders covers all the facets of procurement strategies with its holistic industry reports, extensive production cost and pre-feasibility insights, and price trends dynamics impacting the cost trajectories of the plethora of products encompassing various industries. With the best analysis of the market trends and comprehensive consulting in light of the best strategic footstep, Procurement Resource got all that it takes.
Procurement Resource has made a mark for itself in terms of its rigorous assistance to its clientele. Our experienced panel of experts leave no stone unturned in ensuring the expertise at every step of our clients' strategic procurement journey. Our prompt assistance, prudential analysis, and pragmatic tactics considering the best procurement move for industries are all that sets us apart. We at Procurement Resource value our clients, which our clients vouch for.
Expertise, judiciousness, and expedience are the crucial aspects of our modus operandi at Procurement Resource. Quality is non-negotiable, and we don't compromise on that. Our best-in-class solutions, elaborative consulting substantiated by exhaustive evaluation, and fool-proof reports have led us to come this far, making us the ‘numero uno' in the domain of procurement. Be it exclusive qualitative research or assiduous quantitative research methodologies, our high quality of work is what our clients swear by.