Product
Silver Price Trend and Forecast
Silver Price Trend and Forecast
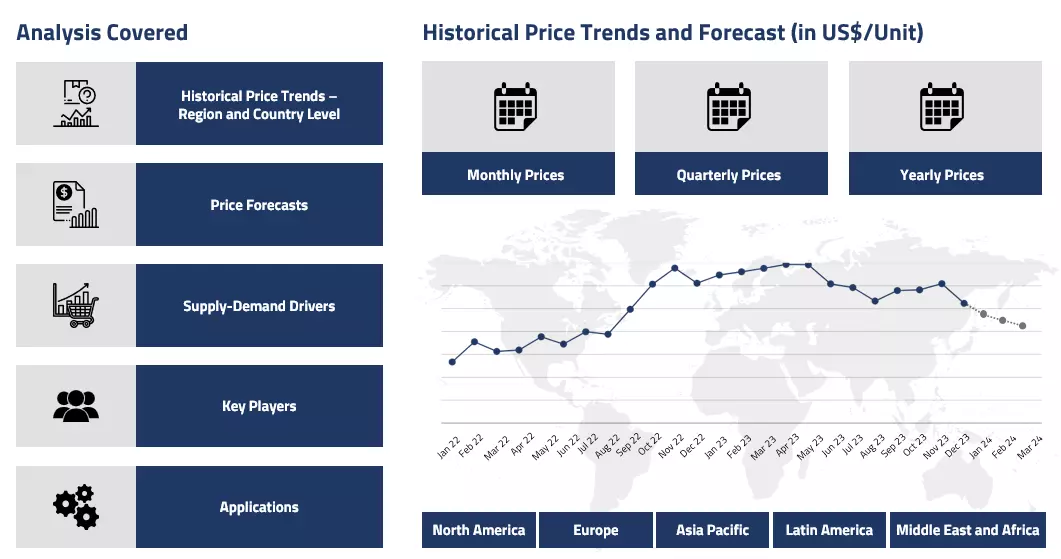
Silver Regional Price Overview
Get the latest insights on price movement and trend analysis of Silver in different regions across the world (Asia, Europe, North America, Latin America, and the Middle East & Africa).
Silver Price Trend for Q1 of 2025
| Product | Category | Region | Price | Time Period |
| Silver | Energy, Metals and Minerals | Europe | 30 USD per troy | January |
| Silver | Energy, Metals and Minerals | Europe | 32 USD per troy | February |
| Silver | Energy, Metals and Minerals | India | 32 USD per troy ounce | January |
| Silver | Energy, Metals and Minerals | India | 34 USD per troy ounce | March |
Stay updated with the latest Silver prices, historical data, and tailored regional analysis
During the first quarter of 2025, silver prices saw gradual increases in major global markets, reflecting strong investor demand and rising industrial consumption. The metal moved in tandem with gold, as both were influenced by global economic uncertainty, shifting monetary policies, and inflation concerns. Amid financial market volatility, investors turned to silver as a hedge against inflation and currency fluctuations.
Silver Price Chart
Please Login or Subscribe to Access the Silver Price Chart Data
The steady price increase indicated that silver remained a preferred asset for wealth preservation during uncertain times. Beyond investment demand, industrial consumption also contributed to the upward price trend. China, the largest consumer of silver, experienced strong manufacturing activity, driven by government stimulus aimed at accelerating industrial output.
Demand for silver was primarily fueled by the electronics and renewable energy industries, particularly in solar panel production. Given silver's high conductivity, its role in the green energy transition remained a key driver of price movements ahead of the summer months. With growing industrial usage, silver's significance as both an investment asset and a critical raw material became more pronounced. Similarly, in Indian markets, prices followed an upward trajectory, rising from about 32 USD per troy ounce in January to around 34 USD per troy ounce in March.
Meanwhile, silver prices in Europe also increased, driven by global economic uncertainty and a weakening US dollar. Prices stood at approximately 30 USD per troy ounce in January and around 32 USD per troy ounce in February. Investors sought silver as a safe-haven asset amid concerns over a potential economic recession, inflation, and geopolitical tensions, particularly the ongoing Russia-Ukraine conflict. This heightened demand contributed to the overall price rise.
Analyst Insight
According to Procurement Resource, the sliver price graph is expected to continue the upward trend in the near future influenced by the high demand for the commodity and other macroeconomic factors.
Silver Price Trend for the Second Half of 2024
The prices of silver remained bullish globally in the second half of 2024. The metal saw a significant rise in prices following the announcement of U.S. Federal Reserve rate cuts, which weakened the dollar and made silver a more attractive and safe investment during turbulent times. Compared to gold, which also experienced strong gains, silver was viewed as a more affordable option, driving increased demand. Additionally, industrial demand for silver grew, particularly in sectors such as electronics, solar energy, and electric vehicles. This growth, combined with the interest rate cuts, significantly boosted the metal's market value.
In India, silver prices saw an unusual spike in demand during the middle of the period. The festive season, along with silver's cultural significance during Dhanteras and Diwali, created positive market sentiment. The rise in jewelry prices around these festivals further supported the upward trajectory of silver. Overall, silver prices maintained an upward trend, driven by positive market sentiment in the second half of 2024.
Analyst Insight
According to Procurement Resource, the prices of silver are expected to showcase a similar trend. Silver is currently an attractive option for investors, providing protection against broader economic risks with expectations of stable future growth.
Silver Price Trend for the First Half of 2024
| Product | Category | Region | Price | Time Period |
| Silver | Energy, Metals and Minerals | China | 26,670 USD per troy ounce | Jan'24 |
| Silver | Energy, Metals and Minerals | China | 34,501 USD per troy ounce | June'24 |
Stay updated with the latest Silver prices, historical data, and tailored regional analysis
The silver price curve exhibited a bullish trend during the first half of 2024. A cooling labor market and declining retail sales suggested weak economic activity, which primarily drove increased investments in bullion amid expectations of interest rate cuts by the US Federal Reserve. These anticipated cuts were expected to make bullion a safer and more attractive high-return option. Silver prices remained steady in the early months but began to rise as market participants anticipated an imminent rate cut. The monthly average price was approximately 26,670 USD per troy ounce in January, increasing to around 34,501 USD per troy ounce in June in the Chinese market.
Demand from downstream sectors, including jewelry, electric vehicle manufacturing, solar panels, and 5G antenna production, remained stable. Rising industrial demand in the electronics and healthcare sectors further supported silver prices. While silver mining exhibited a stagnant trend, recycling efforts ensured a continuous supply to meet growing demand. This balance between supply and demand contributed to stable market dynamics. However, macroeconomic policy changes, particularly toward the end of the period, caused prices to rise further.
Analyst Insight
According to Procurement Resource, the prices of silver look optimistic in the coming months. The awaited Federal Reserve interest cuts and current demand trajectory will influence the price of silver.
Silver Price Trend for the Second Half of 2023
Silver prices continued their bullish run in the global market during the last two quarters of 2023 as well. The third quarter was steadier and more stable compared to the final quarter as the last quarter was relatively more positively inclined.
The downstream demands from the jewel and electronics industries were still steady during the early months. However, the onset of the festival seasons across the globe and the wedding season in India, one of the biggest jewellery markets in the world fueled the downstream consumption, which speedily escalated the price trend in the upward direction. Overall, positive market sentiments were witnessed in H2’23.
Analyst Insight
According to Procurement Resource, given the current demand trajectory, a further escalation is expected in the precious metal’s price graph going forward.
Silver Price Trend for the First Half of 2023
In the first two quarters of 2023, the prices of silver showcased a volatile trajectory. In addition to being a valuable metal in jewelry production, its exceptional conductivity for both electricity and heat makes it an essential component in the electronics industry and thus is used in everything from printed circuit boards to high-performance electrical connectors.
The downstream demands from the jewel and electronics industries were still steady during the early months. However, the onset of the festival seasons across the globe and the wedding season in India, one of the biggest jewellery markets in the world fueled the downstream consumption, which speedily escalated the price trend in the upward direction. Overall, positive market sentiments were witnessed in H2’23.
Analyst Insight
According to Procurement Resource, given the current demand trajectory, a further escalation is expected in the precious metal’s price graph going forward.
Silver Price Trend for the Second Half of 2022
The last two quarters of 2022 struggled to maintain the momentum of silver prices as the global market of silver fluctuated throughout this phase. In the US markets, the increase in the interest rates by the US Federal Reserve to keep the economic conditions afloat hampered the growth of the silver price trend.
The slow rate of industrial development also concerned the traders of silver as the onset of a phase of recession amid the weak condition of the global economy restricted the spending capacity of consumers. However, the usage of silver components in the renewable energy sector, its applications in the production of automobiles, and the increased demand for 5G enabled devices supported the dynamics of the silver price trend.
Analyst Insight
According to Procurement Resource, the price trend of Silver are expected to follow an oscillating trajectory in the upcoming quarters as the demand and market sentiments of downstream industries seem to be fluctuating.
Silver Price Trend For the Second Quarter of 2022
| Product | Category | Region | Price | Time Period |
| Silver | Energy, Metals and Minerals | Europe | 22.22 USD/ounce | May'2022 |
| Silver | Energy, Metals and Minerals | North America | 20.23 USD/ounce | June'2022 |
| Silver | Energy, Metals and Minerals | China | 4958 RMB/MT | April'2022 |
| Silver | Energy, Metals and Minerals | India | 61,625/INR | May'2022 |
| Silver | Energy, Metals and Minerals | India | 60,609/INR | June'2022 |
Stay updated with the latest Silver prices, historical data, and tailored regional analysis
Asia
In April, the silver prices in China were around 4958 RMB/MT rising by 3.94% since the beginning of the year. With rising interest rates, the stocks in Asia faced uncertainty in the third week of May as silver prices climbed to 61,625 Rs per kg in India and later crossed the 62,000 Rs per Kg mark. By the third week of June, per kg price of silver reached Rs. 60,609.
Europe
By the end of May, silver prices were traded at around 22.22 USD/ounce, rising by 0.50% in a week.
North America
In the US, by the end of the second quarter, silver prices witnessed a two-year low at 20.23 USD/ounce. In the beginning of the quarter, however, the price at reached a high of 25.91 USD/ounce which later dropped by the third week of May.
The price then stabilised and hovered around 22 USD/ounce for the rest of the quarter. Nonetheless, silver prices had been more volatile than gold due to factors like record high inflation as well as supply constraints in regions with high demand.
Silver Price Trend For the First Quarter of 2022
Asia
In early trade on February 14, 2022, the average price of the metal was 4882.67 RMB/kg, a daily fall of 2.53%. The price trend of precious metals had a solid long-term convergence, and the trend was essentially the same. During the first quarter of 2022, silver prices soared.
Stocks and bonds in the United States sank dramatically overnight as inflation statistics in the United States again exceeded expectations. Inflation data boosted investors' hedging and hedging sentiment. The price of metal increased as a defensive asset to safeguard against excessive inflation. The actual negative interest rate in Q1 2022 was beneficial to precious metals. The market was anticipating the announcement of an interest rate rise.
Latin America
In Q1 of 2022, gold and silver prices stayed constant or dropped, with interest rates and global monetary policy influencing patterns. However, additional losses and new highs are predicted in precious metals in the coming years. Mining firms in Latin America were benefiting from recent increases in gold and silver prices, which had raised cash flows and treasuries, allowing them to invest in asset optimization and, in some cases, move forward with development projects. Silver prices were recorded at 40 USD/oz during Q1 of 2022.
Silver Price Trend For the Fourth Quarter of 2021
Asia
In India, growing industrial usage of the metal following the pandemic provided people with windfall investment gains in Q-4 of 2021. Investors accessed the white metal's potential after the financial market regulator launched a Silver Exchange Traded Trust, as prices outperformed gold by as high as 6.41%. The metal is gaining popularity among investors. It is currently both an investment and a commodity for industrial use. Its application is projected to increase in the future as the global economy recovers.
Europe
Prices of precious metals fell in the second period of 2021, owing to weakening market mood and weak physical demand. Prices fell due to dwindling commercial demand. Since mid-November, silver prices had experienced a significant retracement. Industrial demand for the metal had dwindled, putting downward pressure on prices. The metal’s near-term prospects are largely dependent on the sustainability of the world economy, which has been harmed by a recurrence of COVID infections, notably in Europe.
North America
Spot prices resumed their upward trend throughout the Christmas period, climbing 5% in two weeks to reach 23.29 USD/oz, up 4% on 13 January 2022, but they have since retreated somewhat to 23.11 USD/oz. Silver is currently about 22% below its eight-year peak of 29.585 USD/oz reached in February 2021.
Expectations of a price rally have been developing in reaction to rising inflation and socioeconomic uncertainty, as central banks, particularly the US Federal Reserve, signaled they would ease fiscal stimulus and begin raising interest rates in the new year.
Silver Price Trend For First, Second and Third Quarters of 2021
Asia
In India, silver prices were about 5% higher in August 2021, than they were when they opened at 68,254 INR/kg in January 2021. The price also outperformed gold's in the due course. This was due to silver's dual nature. It is classified as a precious metal as well as an industrial metal. Apart from this, the metal's demand-supply imbalance was exacerbated by dwindling mine supply.
Its diminishing mine supply aided the price increase. Apart from that, the base metals complex also saw a broad-based rise, with prices surging to multi-year highs. The price increased by 888 INR/kg, to 62,452 INR/kg in July 2021. In China, investors jumped into silver investments, boosting Shanghai prices while also enhancing the performance of connected equities and funds. Silver prices in China increased to their highest level since September 2020. Shanghai Futures Exchange prices closed 9.27% higher, at 5,939 RMB/kg.
Europe
Silver had numerous setbacks since the outbreak began. Prices increased by more than 47% in comparison to FY 2020, and settled at 29.418 USD/oz on February 1, with a Reddit-induced surge pushing the metal's value to its highest level since February 2013. Silver prices subsequently had a wild decline, eventually closing at 21.485 USD/oz on September 29, the lowest level since July 2020. The price trend began a precipitous decline in June 2021.
North America
Demand increased significantly in May 2021 when compared to the previous 12 months. The metal was trading at over 27 USD/oz, up 74% from a year earlier when it was trading at roughly 15.5 USD/oz. However, demand for the semi-precious metal was greater than supply in 2021. Its application in industry was a significant factor in its increase in value. Additionally, green technologies increased demand for industrial metals like silver, which is utilised in the manufacture of solar panels.
It also benefited from the world economy's reopening during the coronavirus pandemic, as industrial production increased, and investment demand remained stable. Conversely, in September 2021, silver price value fell to its lowest level in more than a year as the US currency strengthened. Spot silver plunged 4.3% in a single day to 21.50 USD/oz, while December 2021 prices fell by the same proportion.
Latin America
In 2021, prices remained essentially constant or decreased, with trend dictated by bond yields and global monetary strategy. Mining businesses throughout Latin America reaped the benefits of the increase in gold and silver prices, which boosted cash flows and treasuries and enabled them to engage in asset optimization and, in some cases, development projects. Silver followed the aforementioned track, rising to roughly 27 USD/oz in mid-2020 and then declining to around 25 USD/oz in 2021.
Silver Price Trend For the Year 2020
Asia
Silver futures in August 2020, India, closed over 2% or 754 points lower at 35,453 INR/kg. The trend was widespread. The coronavirus outbreak shut down major production hubs worldwide, most notably in China, the world's factory and the virus's origin. In February, China's factory activity fell to its lowest level in history. According to official figures issued by the Chinese administration, industrial output in the country fell 13.5% year on year in January-February, compared to a 6.9% growth in December.
Prices increased in China during the fourth quarter as the government sought to decarbonize the entire economy. Increased demand for climate-friendly items such as electric vehicles and solar panels reportedly boosted its value as well.
Europe
When the Covid crisis struck in February 2020, silver compressed a half-worth decade's of market activity into only five months. Prices fell 40% to the lowest level since 2009, hovering about 12 USD/oz in March 2020. On the other hand, the price soared to eight-year highs following that, just short of $30 in February 2021. However, the increase slipped away as quickly as it had arrived, leaving the market stagnant for five weeks as much of the speculative buying was immediately reversed.
North America
The price had risen 34% in July alone, exceeding the performance of each and every leading international financial asset. July was one of the strongest months on record for the metal, with the largest monthly gain since 1979. However, in August 2020, the metal maintained its year-to-date price performance.
From 11.64 USD/oz on March 18, 2020, the price soared more than 140% in August, reaching a level not seen since 2013. The price increase was spurred by its intrinsic safe-haven status, inflation fears, extraordinarily low interest rates, and continuous central bank liquidity injections. The increase in price indicated increasing interest in the metal as an investment vehicle by both retail and institutional investors.
Latin America
Regionally, Central and South America saw a 13% drop in its price. Nonetheless, Mexico regained its position as the world's biggest silver producer. Mexico's potential was enhanced by a bull market and rising demand. Mexico produced roughly 178 million ounces of the metal in 2020, while Peru produced 110 million ounces. The LBMA reported that the average yearly price jumped from 16.19 USD/oz in 2019 to 20.52 USD/oz the year before, a 27% year-over-year gain.
Following the mining industry's fall in mineral demand in 2020 as a result of COVID-19, a slump in the prices increased pressure on Latin America's mining corporations, as enterprises battled to respond to market volatility caused by the coronavirus and government steps to slow its spread.
Procurement Resource provides latest prices of Silver. Each price database is tied to a user-friendly graphing tool dating back to 2014, which provides a range of functionalities: configuration of price series over user defined time period; comparison of product movements across countries; customisation of price currencies and unit; extraction of price data as excel files to be used offline.

About Silver
Silver is a naturally occurring element. In appearance, Silver is a white and lustrous metal. It is used as jewellery, silverware, electronic equipment, and dental fillings. It is also utilised to make photographs, in brazing alloys and solders. Silver is known to have the highest electrical conductivity, thermal conductivity, and reflectivity than any metal.
Silver Product Details
| Report Features | Details |
| Product Name | Silver |
| Chemical Formula | Ag |
| Industrial Uses | Brazing alloys, Batteries, Dentistry, Glass Coatings, LED Chips, Medicine, Nuclear reactors, Photography, Photovoltaic (Or Solar) energy, RFID Chips (for tracking), Semiconductors, Ornaments, Touch screens, Water purification |
| Molecular Weight | 107.868 g/mol |
| Synonyms | 7440-22-4, Argentum, Silver metal, Silver atom |
| Supplier Database | Umicore N.V, American Elements, MMC Norilsk Nickel PJSC, Hindustan Zinc Limited, Korea Zinc Co., Ltd., Yunnan Tin Group Company Limited (YTC), Polymetal International plc, Pan American Silver Corporation |
| Region/Countries Covered | Asia Pacific: China, India, Indonesia, Pakistan, Bangladesh, Japan, Philippines, Vietnam, Iran, Thailand, South Korea, Iraq, Saudi Arabia, Malaysia, Nepal, Taiwan, Sri Lanka, UAE, Israel, Hongkong, Singapore, Oman, Kuwait, Qatar, Australia, and New Zealand Europe: Germany, France, United Kingdom, Italy, Spain, Russia, Turkey, Netherlands, Poland, Sweden, Belgium, Austria, Ireland Switzerland, Norway, Denmark, Romania, Finland, Czech Republic, Portugal and Greece North America: United States and Canada Latin America: Brazil, Mexico, Argentina, Columbia, Chile, Ecuador, and Peru Africa: South Africa, Nigeria, Egypt, Algeria, Morocco |
| Currency | US$ (Data can also be provided in local currency) |
| Supplier Database Availability | Yes |
| Customization Scope | The report can be customized as per the requirements of the customer |
| Post-Sale Analyst Support | 360-degree analyst support after report delivery |
Note: Our supplier search experts can assist your procurement teams in compiling and validating a list of suppliers indicating they have products, services, and capabilities that meet your company's needs.
Silver Production Process
- Production of Silver via Smelting.
Silver can be derived or extracted by using smelting or chemical leaching process, where heat and chemical reducing agents are utilised to get the base metal from the ore. Thus, smelting process leaves Silver behind from its ore. However, Silver can also be produced during the electrolytic refining of copper through Parkes process.
Methodology
The displayed pricing data is derived through weighted average purchase price, including contract and spot transactions at the specified locations unless otherwise stated. The information provided comes from the compilation and processing of commercial data officially reported for each nation (i.e. government agencies, external trade bodies, and industry publications).
Assistance from Experts
Procurement Resource is a one-stop solution for businesses aiming at the best industry insights and market evaluation in the arena of procurement. Our team of market leaders covers all the facets of procurement strategies with its holistic industry reports, extensive production cost and pre-feasibility insights, and price trends dynamics impacting the cost trajectories of the plethora of products encompassing various industries. With the best analysis of the market trends and comprehensive consulting in light of the best strategic footstep, Procurement Resource got all that it takes.
Client's Satisfaction
Procurement Resource has made a mark for itself in terms of its rigorous assistance to its clientele. Our experienced panel of experts leave no stone unturned in ensuring the expertise at every step of our clients' strategic procurement journey. Our prompt assistance, prudential analysis, and pragmatic tactics considering the best procurement move for industries are all that sets us apart. We at Procurement Resource value our clients, which our clients vouch for.
Assured Quality
Expertise, judiciousness, and expedience are the crucial aspects of our modus operandi at Procurement Resource. Quality is non-negotiable, and we don't compromise on that. Our best-in-class solutions, elaborative consulting substantiated by exhaustive evaluation, and fool-proof reports have led us to come this far, making us the ‘numero uno' in the domain of procurement. Be it exclusive qualitative research or assiduous quantitative research methodologies, our high quality of work is what our clients swear by.
Related News

Table Of Contents
Our Clients
Get in Touch With Us

UNITED STATES
Phone:+1 307 363 1045

INDIA
Phone: +91 8850629517

UNITED KINGDOM
Phone: +44 7537 171117
Email: sales@procurementresource.com